



On paper, it looks like a win. First home buyers now take out 24% of new home loans, up from 21% at the end of last year. One in four new mortgages goes to someone buying their first home.
Look at the scoreboard, though, and it's a strange kind of win. Here's what it took to get there.
First home buyers' share went up. Their numbers went down
About 26,300 first home buyers took out a loan in the September quarter. That's 3,700 fewer than a year ago, down 12%, and the lowest since early 2023.
Their share only rose because investors fell much harder. Investor loans dropped to about 35,300, down 39% on a year ago. Investors went from a record 41% of new loans in December to 32%.
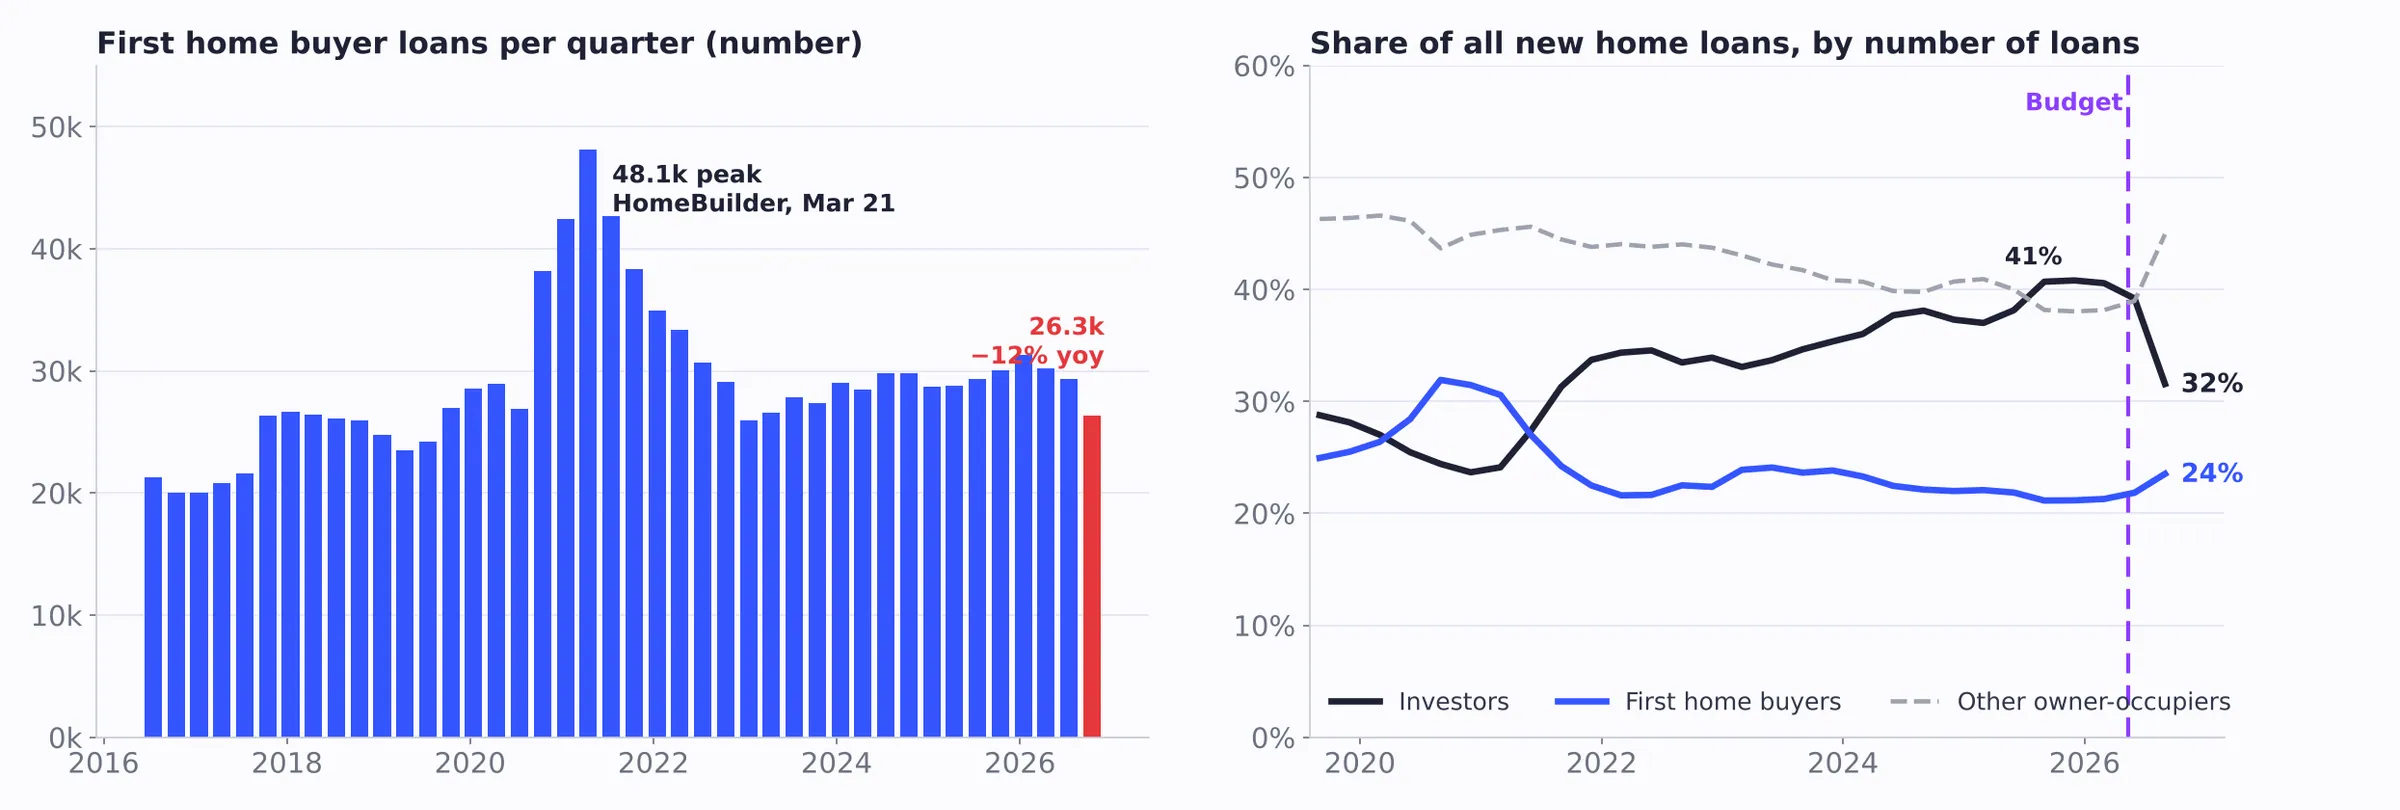
Source: ABS Lending Indicators, September quarter 2026, seasonally adjusted, excluding refinancing. The September first home buyer count is derived from the ABS's reported 12.3% annual fall.
Investor lending had its biggest fall on record
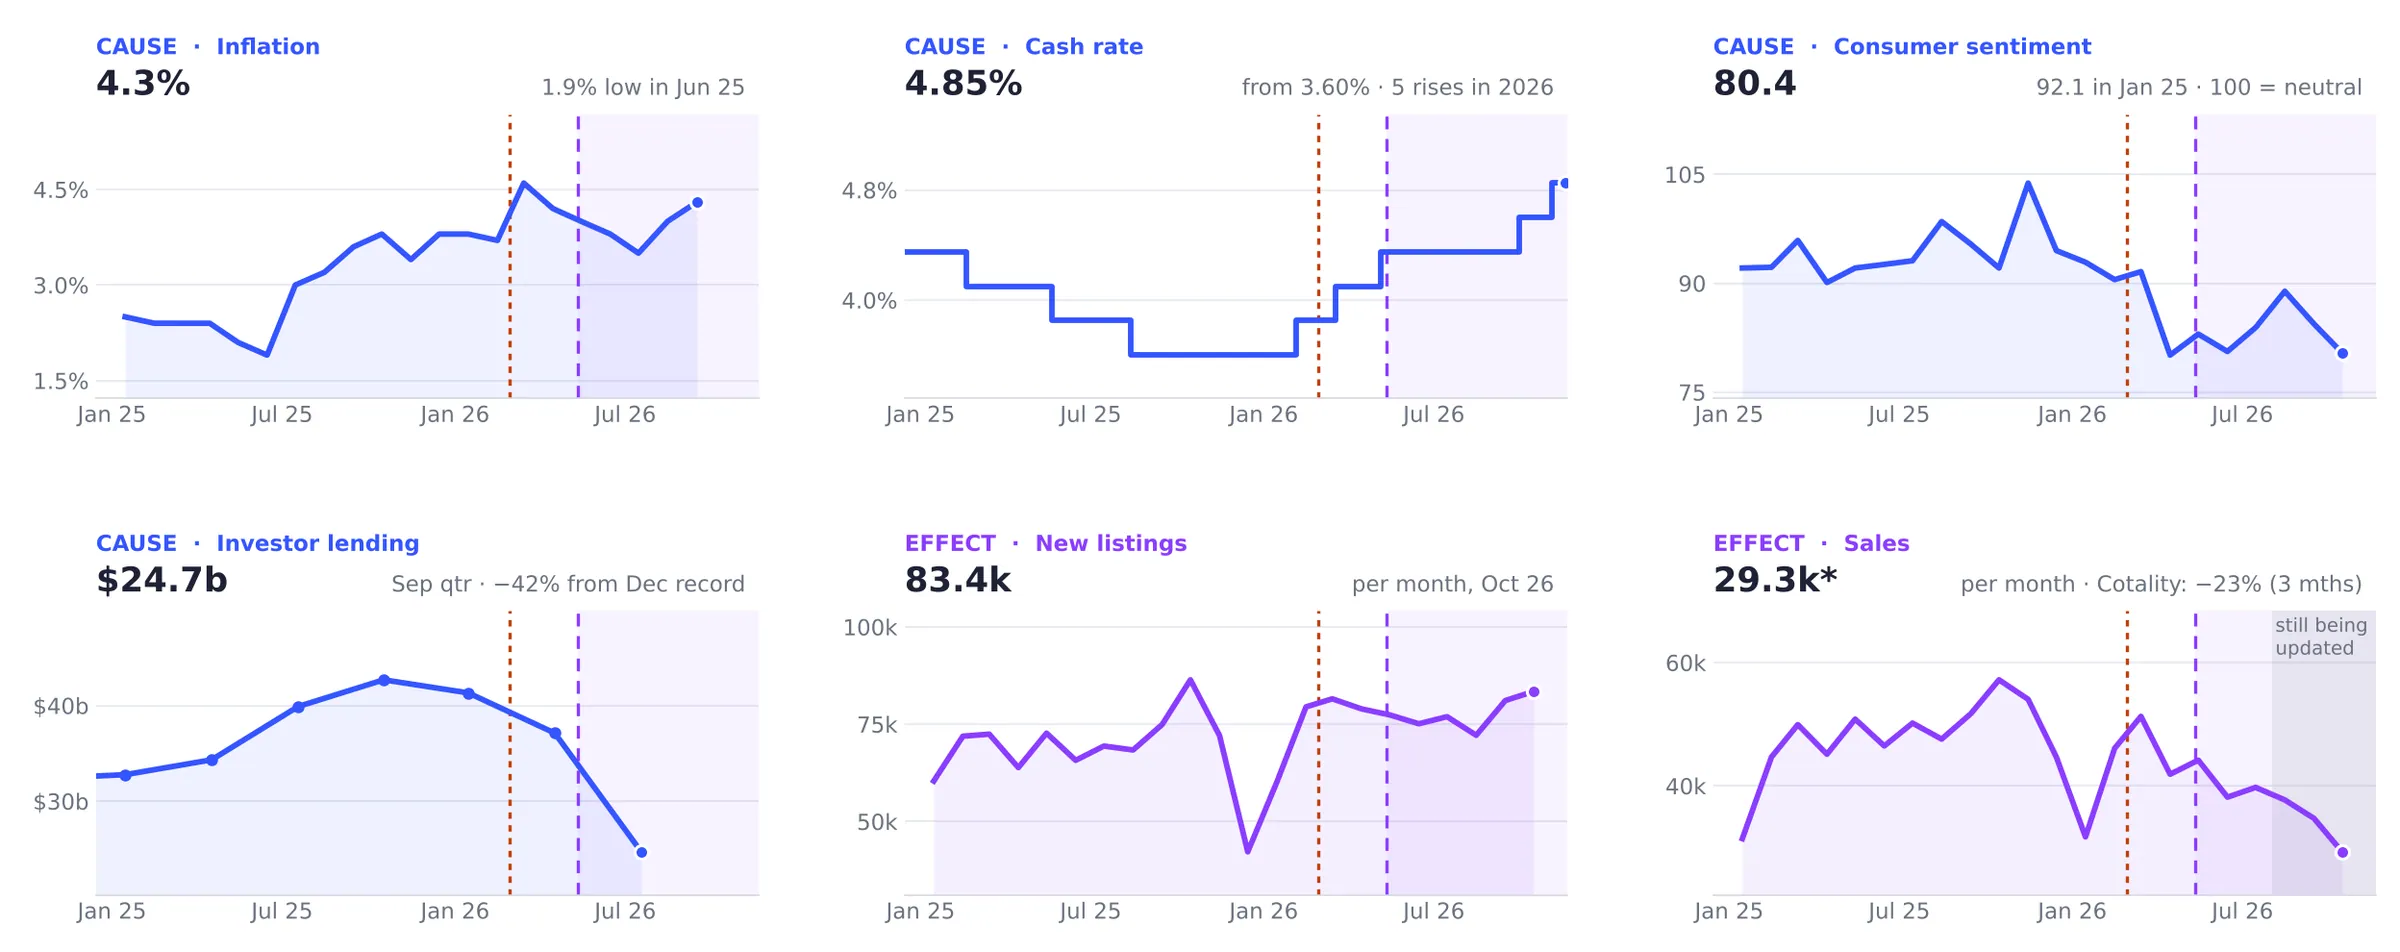
New investor lending fell 32% in the September quarter to $24.7 billion, the first full quarter after the May budget. That's the largest quarterly fall since the ABS series began in 2002, and 42% below December's record.
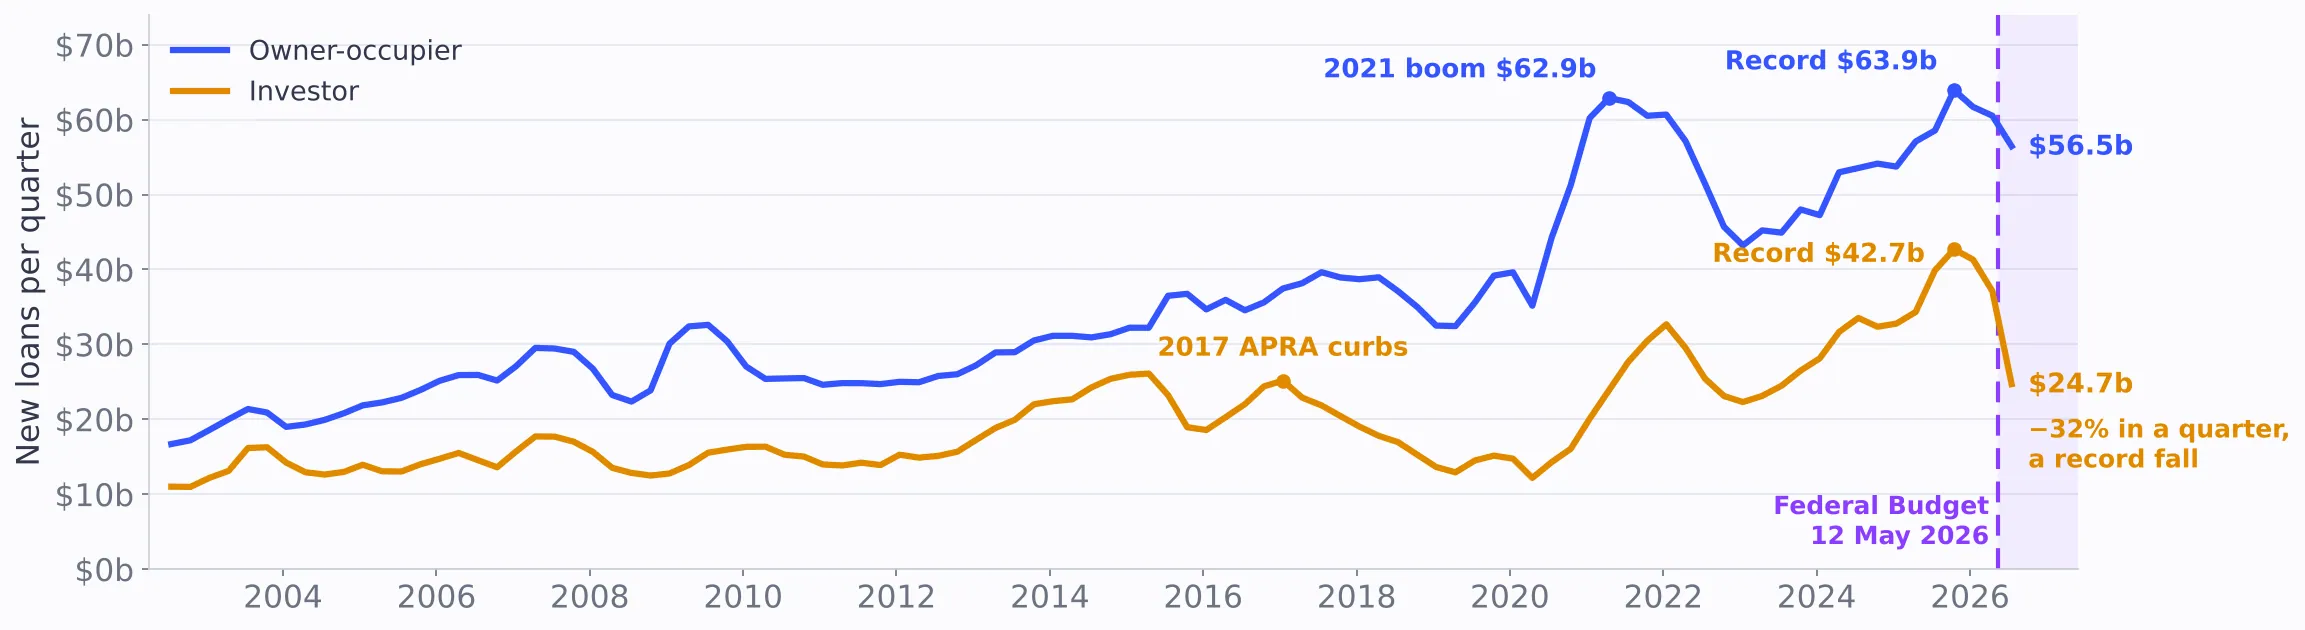
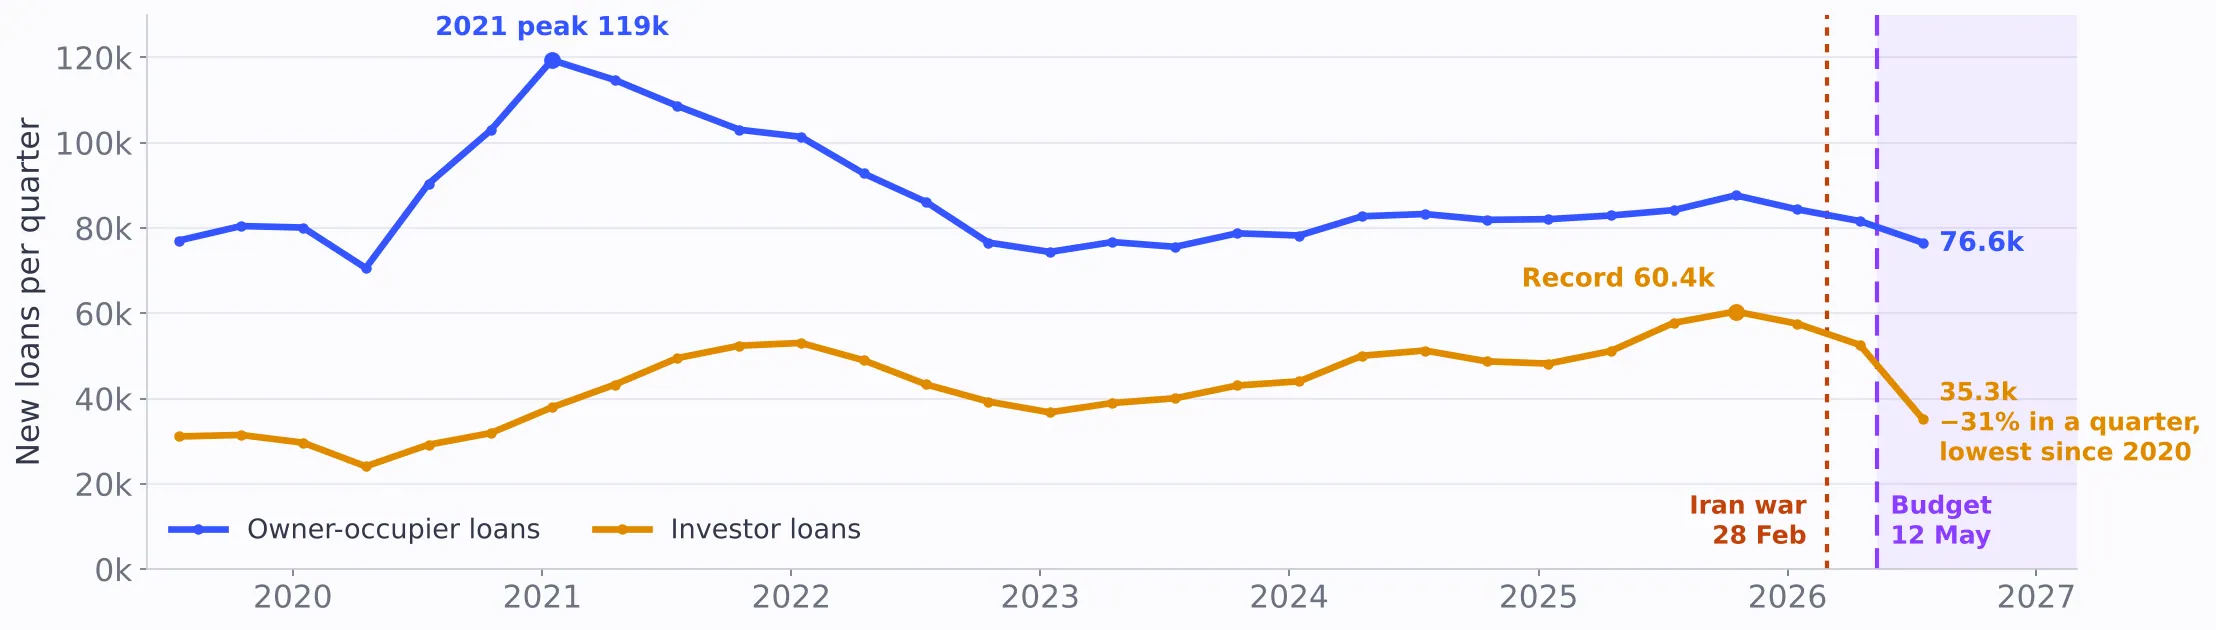
Source: ABS Lending Indicators, released 11 November 2026.
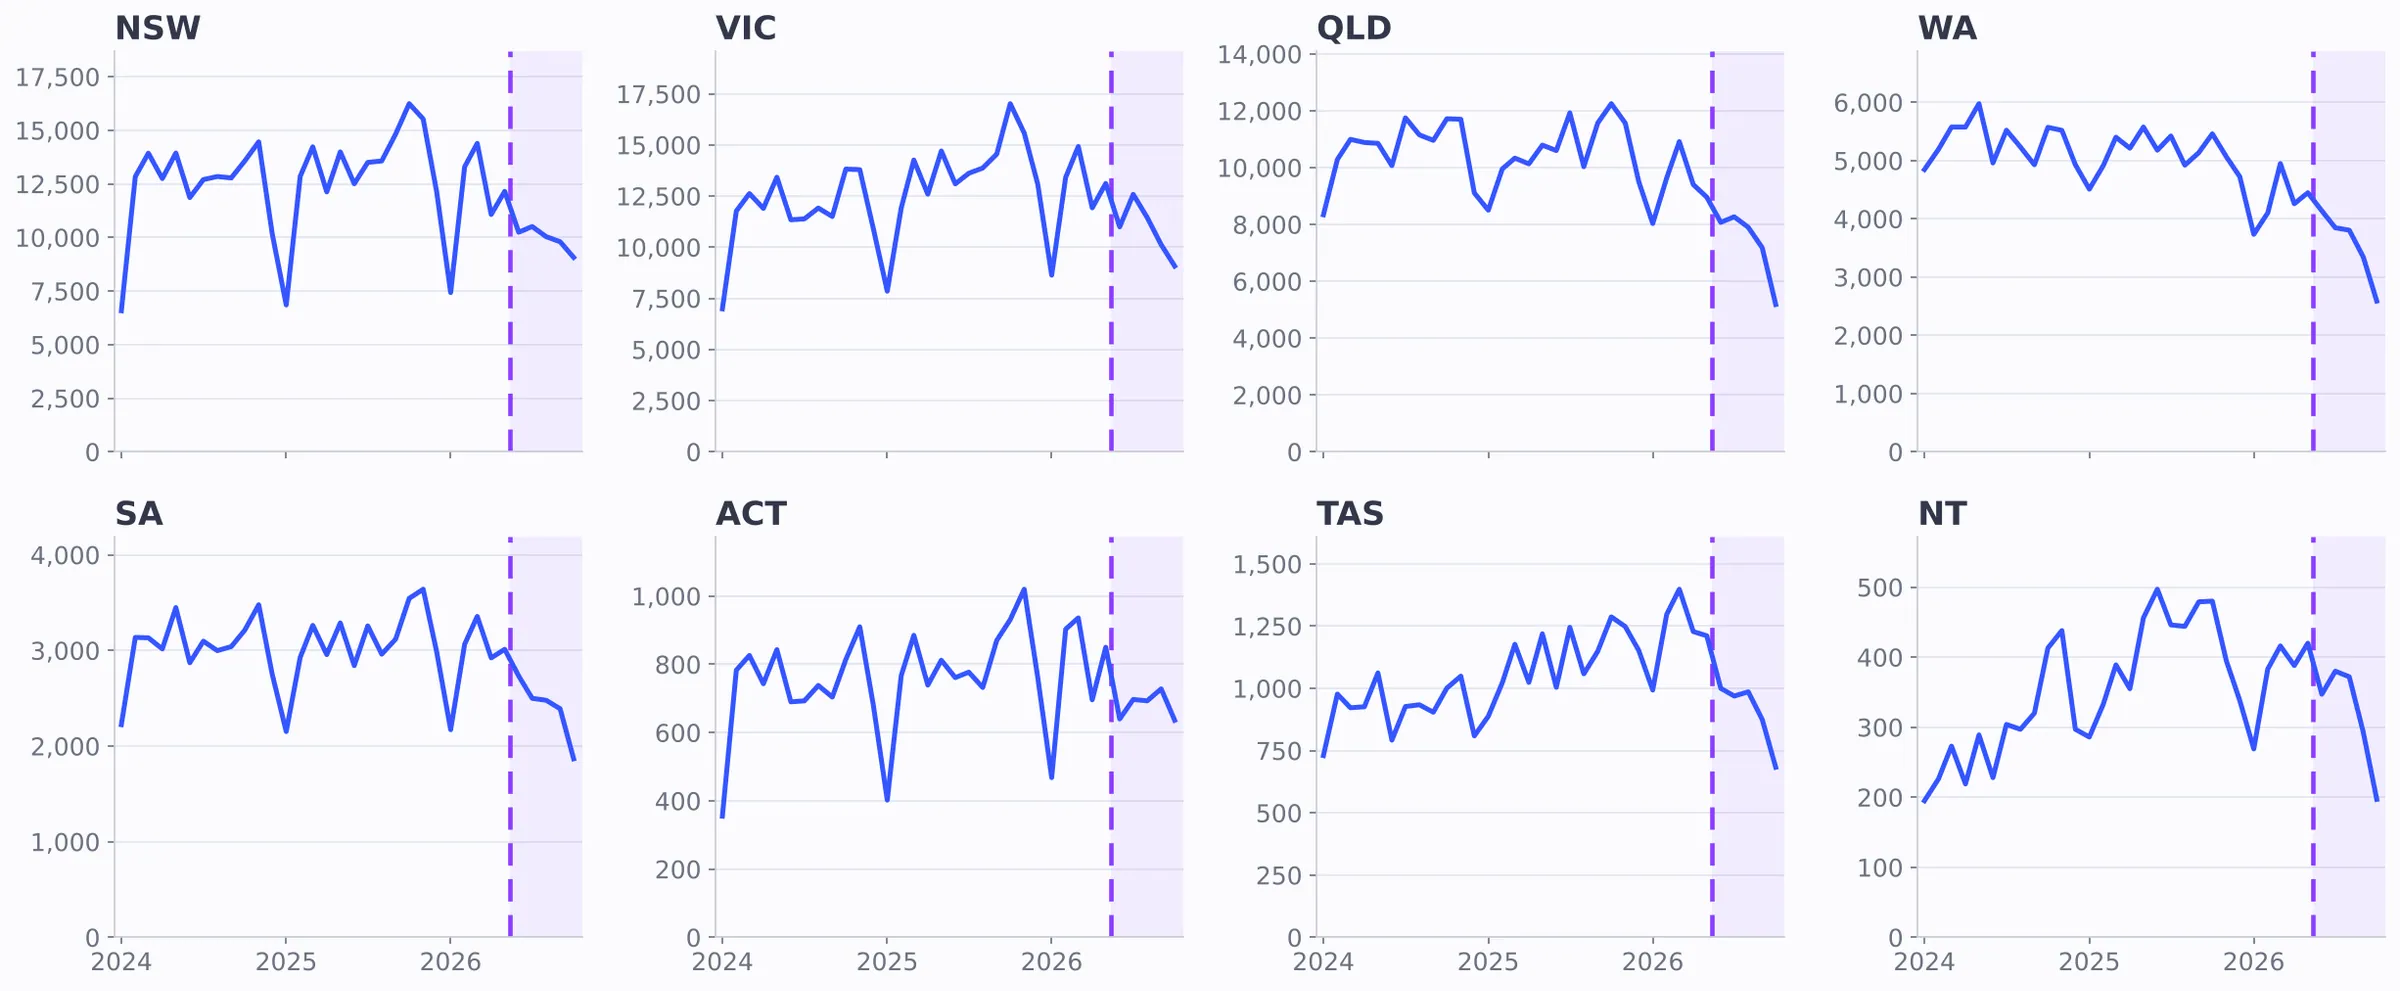
Sales down around 30%
National sales from June to October were 29% below the same months of 2025, about 73,500 fewer homes. Every state is down, from 17% in the ACT to 35% in Queensland. Recent months are still being counted, and Cotality puts the fall at 23% over the three months to October.
What a third fewer sales costs
Every sale carries a chain of fees, so fewer sales means less income for everyone paid per transaction. From June to October, on our estimates:
- About $60 billion less property changed hands
- About $2 billion less stamp duty for the states
- About $1.2 billion less commission for agents
- Around 29% less work for conveyancers, valuers, inspectors, brokers and removalists
For selling agents it's a treadmill. Each sale now takes 2.2 listings, against 1.4 a year ago, so agents need far more listings just to stay in the same spot.
Estimates: about 73,500 fewer sales × an average price of about $820,000, effective stamp duty about 3.3% after concessions, commission about 2%.
Last year's first home buyers are underwater
About 120,000 first home buyers bought in the past 12 months, many with 5% deposits under the expanded scheme. Cotality's index now has values 6.7% below the March peak, about $63,400 off the median dwelling.
Anyone who bought near the top with a 5% deposit now owes more than the home is worth, on paper at least. It only bites if they need to sell or refinance, but it's not where anyone hoped they'd be.
Auctions: four in ten are selling
In the week ending 1 November, the combined capital city clearance rate was 40.7%, the lowest since April 2020. A year earlier it was about 66%. Brisbane fell furthest, from 69% to 24%.
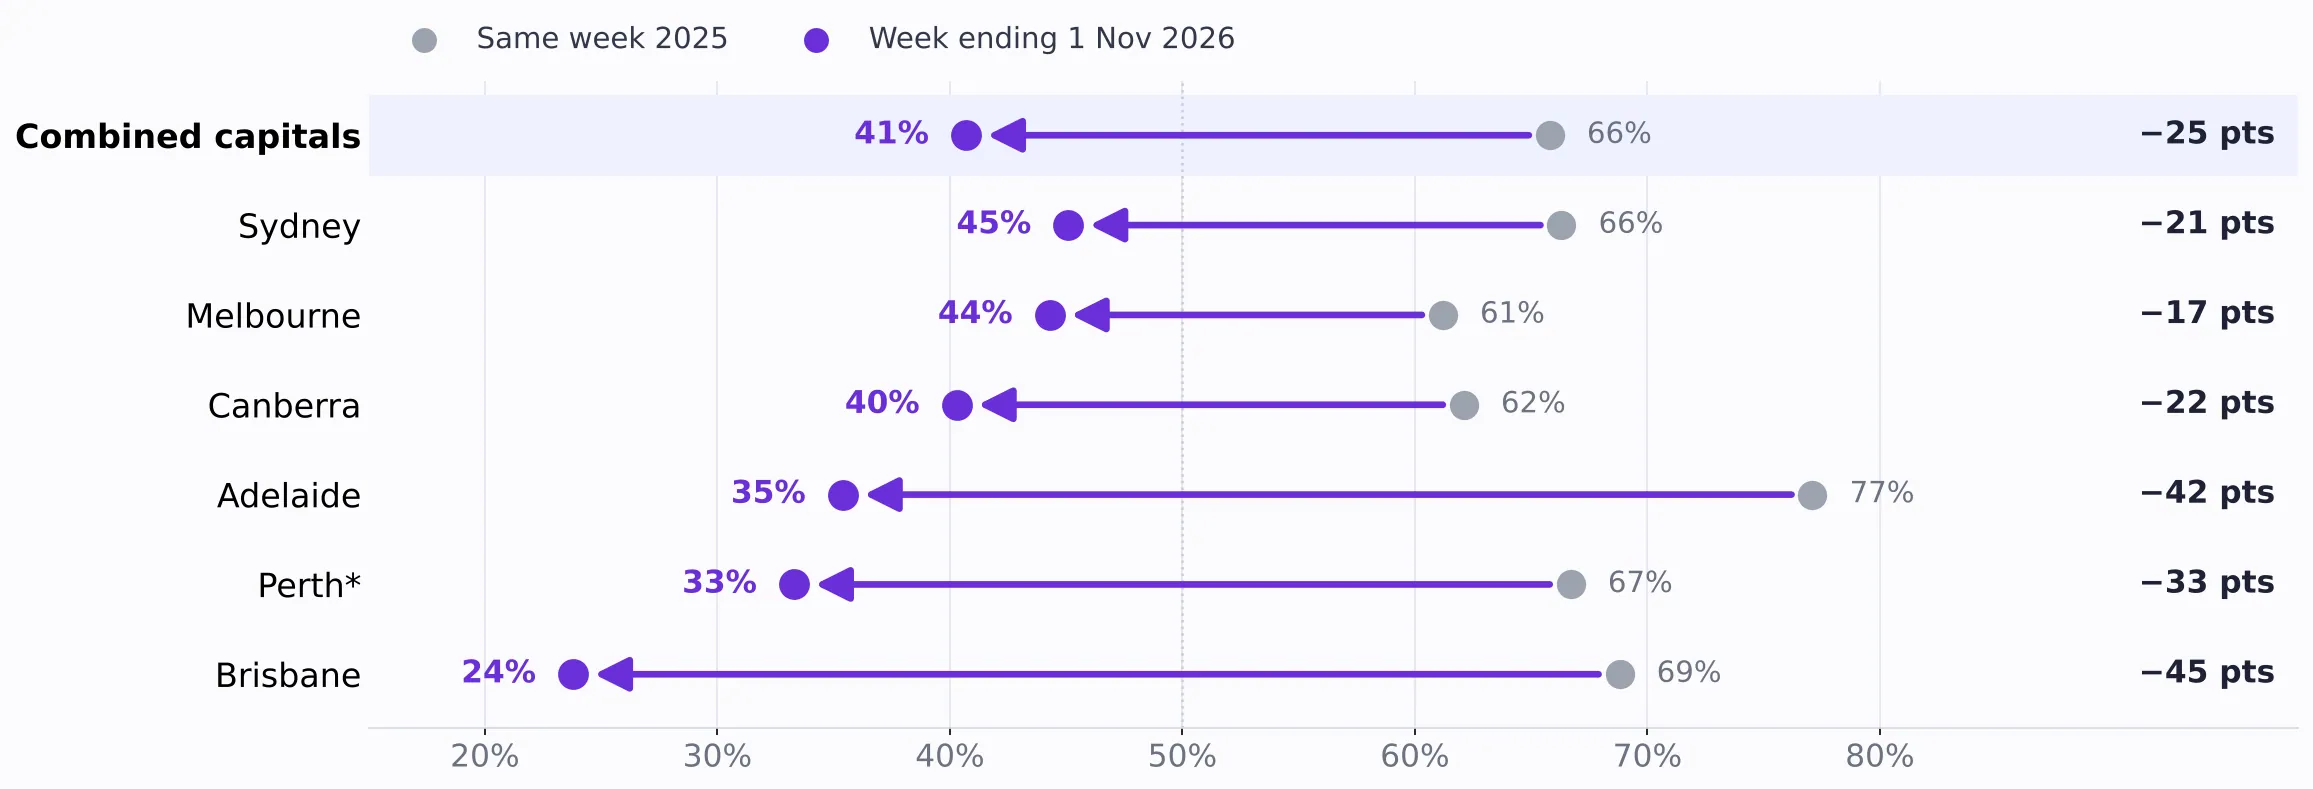
Source: Cotality final clearance rates, week ending 1 November 2026.
What Treasury expected
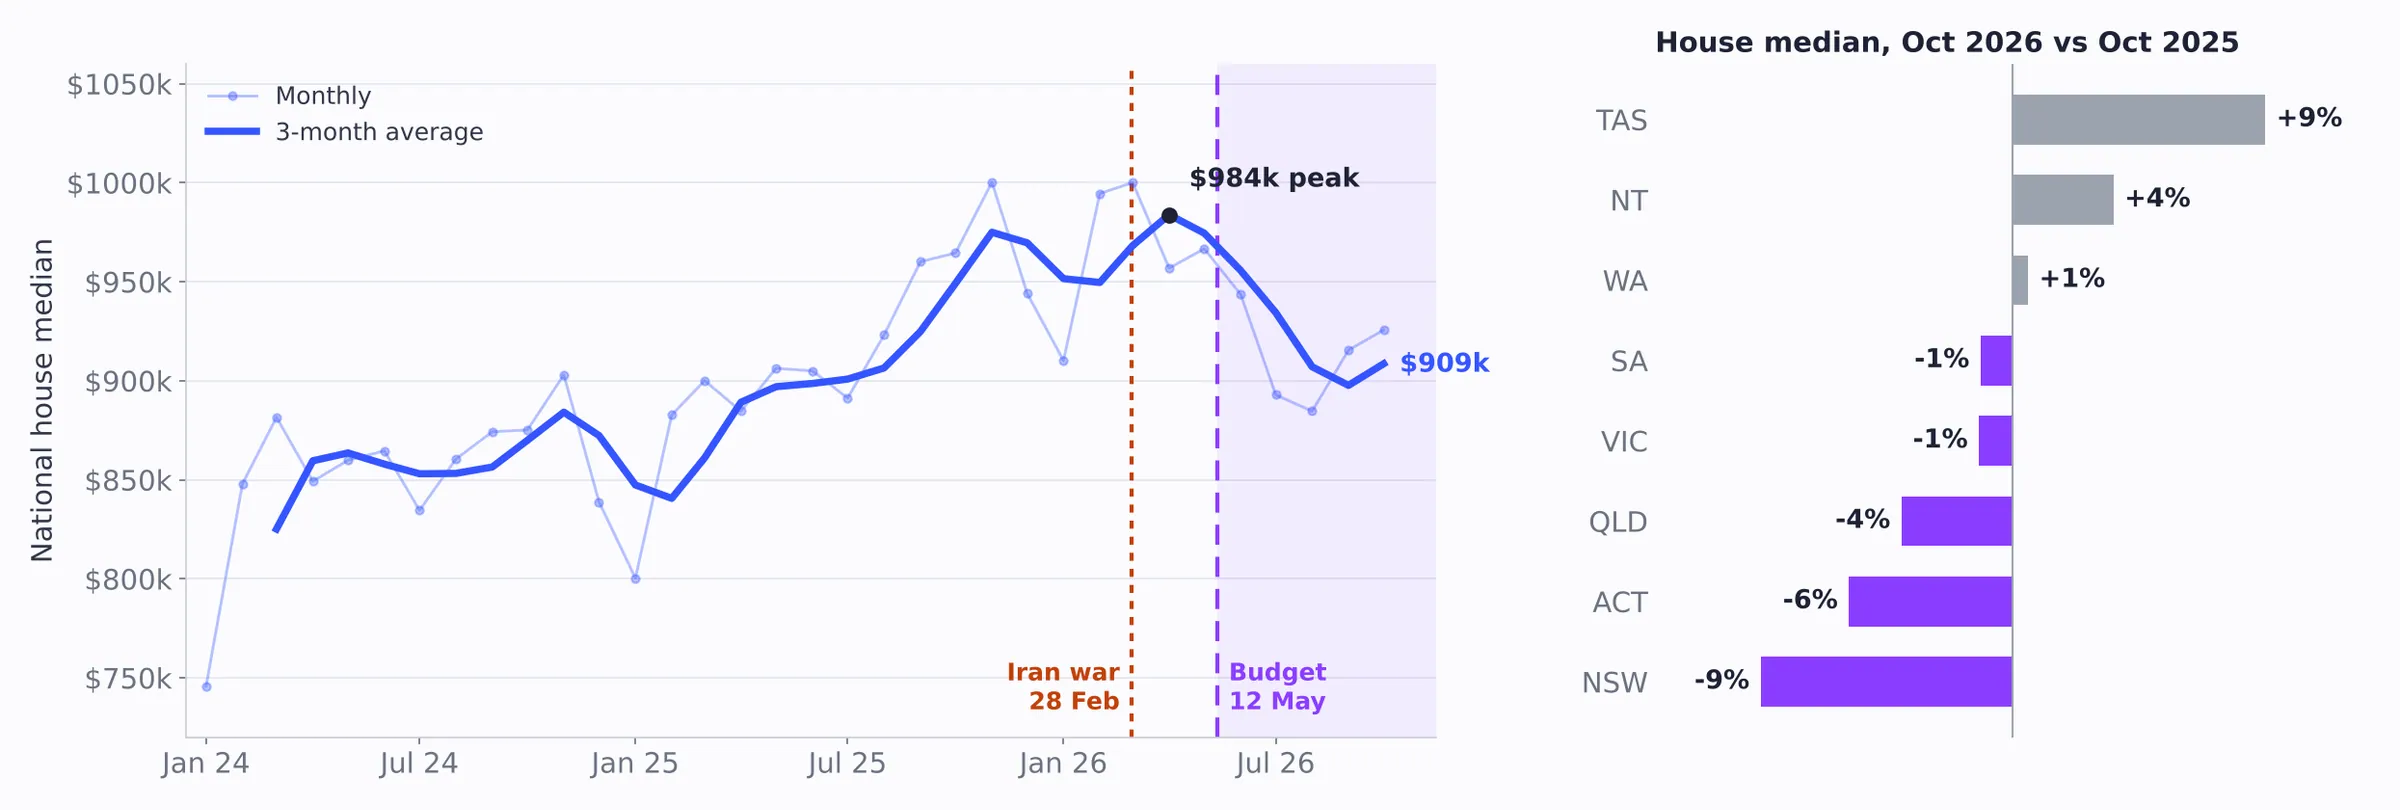
Treasury's Budget modelling had prices still rising, about 4% over two years, and 75,000 more owner-occupiers over a decade. So far, house medians are down 8% from April's peak and investor lending is down a record 32%.
To be fair, Treasury modelled the tax changes alone. Five rate rises landed at the same time, and the changes don't start until July 2027.
So, did it work?
If the goal of the budget changes was to get more people into property, so far it has failed badly.
- Fewer first home buyers, not more. About 26,300 a quarter, down 12% on a year ago. Their bigger share of new loans comes from investors leaving, not from more first home buyers getting in.
- Last year's first home buyers got burned. Many bought near the top on a 5% deposit, and on paper they now owe more than their home is worth.
- The states are worse off. On our estimates, about $2 billion less stamp duty from June to October, money that would otherwise fund state services.
The tax changes don't start until July 2027 and rates did a lot of the damage, so the final verdict is still a way off. But on the scoreboard so far, nobody's winning.
The upside, if you're buying
Fewer investors, fewer bidders and longer campaigns add up to the best negotiating position buyers have had in years. For a client with finance ready, this is the moment.
For the full picture, state by state, read our November 2026 property market update.
Sources: ABS Lending Indicators (September quarter 2026), Cotality Home Value Index (October 2026), Cotality clearance rates, national market stats by state, 2026–27 Budget papers. Dollar figures are estimates. General information only, not financial advice.