



Updated 11 November 2026: new ABS lending data released today. Investor lending fell 32% in the September quarter, the largest quarterly fall since the series began in 2002, and total new home lending fell a record 15.5%. Refinancing also dropped 5%. The lending and refinancing sections below now include the new figures.
Every headline this spring has said the same thing: the market is nervous. The data agrees. National sales from June to October were 29% below the same months of 2025, auction clearance rates have dropped to their lowest since April 2020, and consumer sentiment is 13% lower than a year ago.
But a nervous market is not a bad market for everyone. For a buyer with finance in place and an agent who knows the numbers, this is the strongest negotiating position in years. This property market update for November 2026 walks through what changed, why, and where buyers now hold the most leverage.
In this article:
- The leading indicators: inflation, interest rates, lending, refinancing and confidence
- What the 12 May 2026 Federal Budget changed for investors
- The effect: listings, sales, days on market, prices and auctions
- A state-by-state view of where buyers have the most leverage
- Practical ways buyer’s agents can use this market for their clients
The figures cover January 2024 to October 2026 and come from monthly market statistics by state, the ABS, the RBA, Cotality and the Westpac–Melbourne Institute surveys. Sources are noted under each chart.
What is a buyer’s market?
A buyer’s market is one where there are more homes for sale than there are active buyers, so the balance of bargaining power moves toward the purchaser. You can see it in the data before you see it in prices: sales fall, listings hold or rise, homes take longer to sell, and more auctions pass in. A useful single measure is new listings per sale. Around 1.5 is balanced in recent Australian conditions; the higher it goes, the more choice and leverage a buyer has.
The leading indicators turned first
Listings and sales are the effect. The causes turned months earlier, and none of them has turned back yet. Reading them in order explains why this market has further to run.
Inflation is back above the RBA’s target
Headline inflation fell into the RBA’s 2–3% target band through late 2024 and early 2025, reaching 1.9% in June 2025. That is why the RBA cut rates three times in 2025. It then turned back up.
The US–Israel strikes on Iran began on 28 February 2026. Oil went above US$100 a barrel and petrol above $2 a litre, and headline inflation jumped from 3.7% in February to 4.6% in March. In September it was 4.3%.
The more important number is core inflation. The trimmed mean, which the RBA watches most closely, has risen steadily from 2.7% in early 2025 to 3.6%. The March spike was fuel-driven, but the underlying trend was already heading the wrong way.
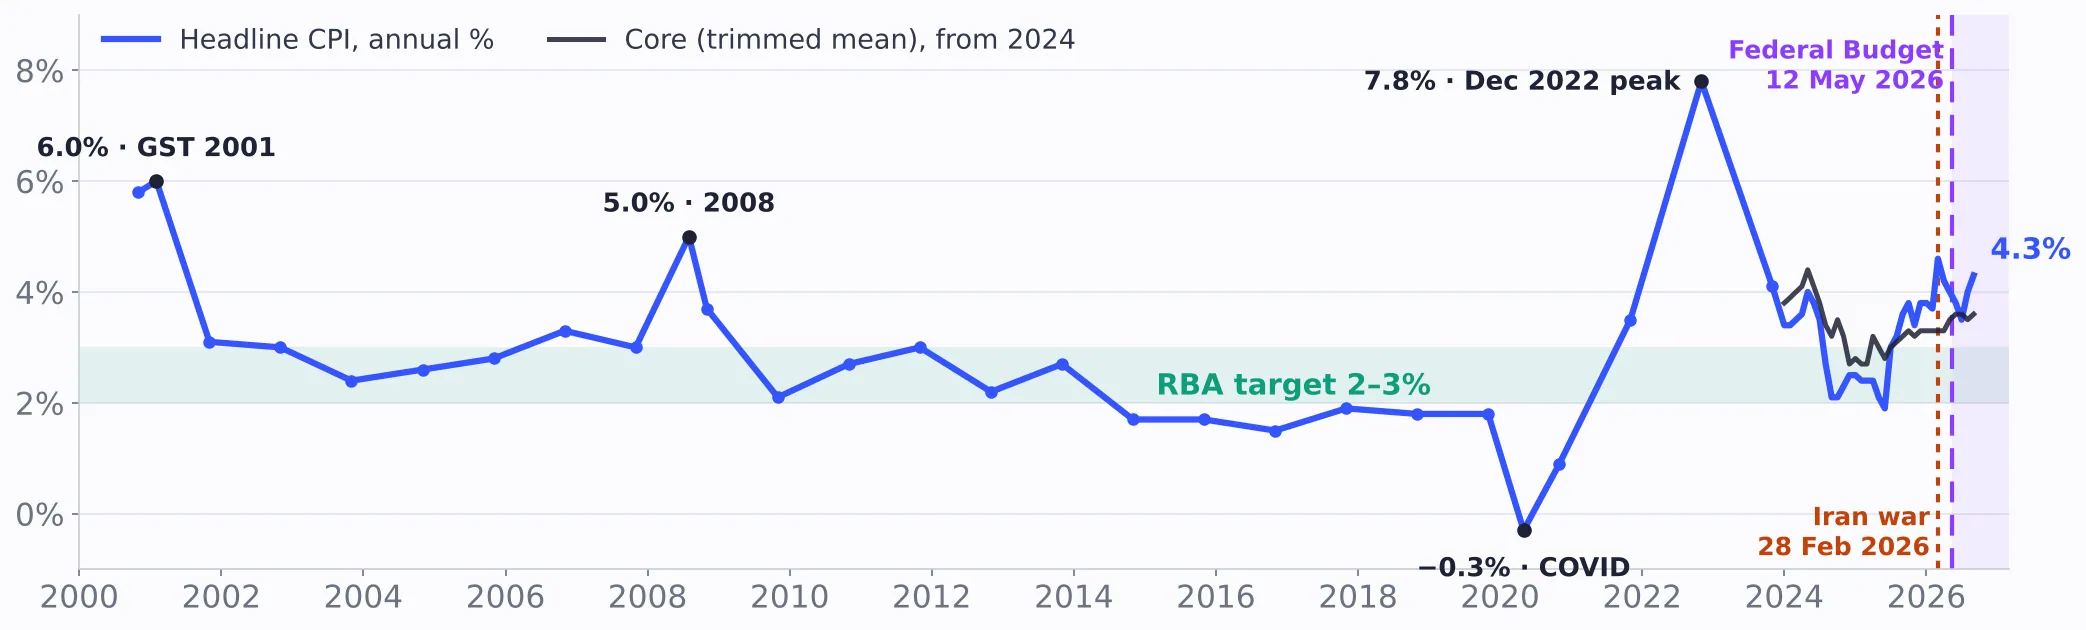
Source: ABS CPI, annual % change. 2000–2023: December quarters plus key turning points; from 2024: monthly CPI. The ABS changed series in April 2025, so the two periods are not perfectly comparable.
Five rate rises in 2026 have wiped out 2025’s cuts
With both inflation measures above the band, the RBA has had to keep lifting rates. The cash rate was 3.60% in January. After rises in February, March, 6 May, 30 September and 4 November, it is now 4.85%, the highest since late 2008.
It is worth being precise about timing. Three of those rises came before the budget. The sales slump that followed is the budget and rates together, not the budget alone.
For a household, the maths is simple. Each 0.25% rise adds roughly $95 a month to the repayments on a $600,000, 30-year principal and interest loan. If the full 1.25% has been passed on, that is about $490 a month more than in January, and a meaningful cut to what buyers can borrow.
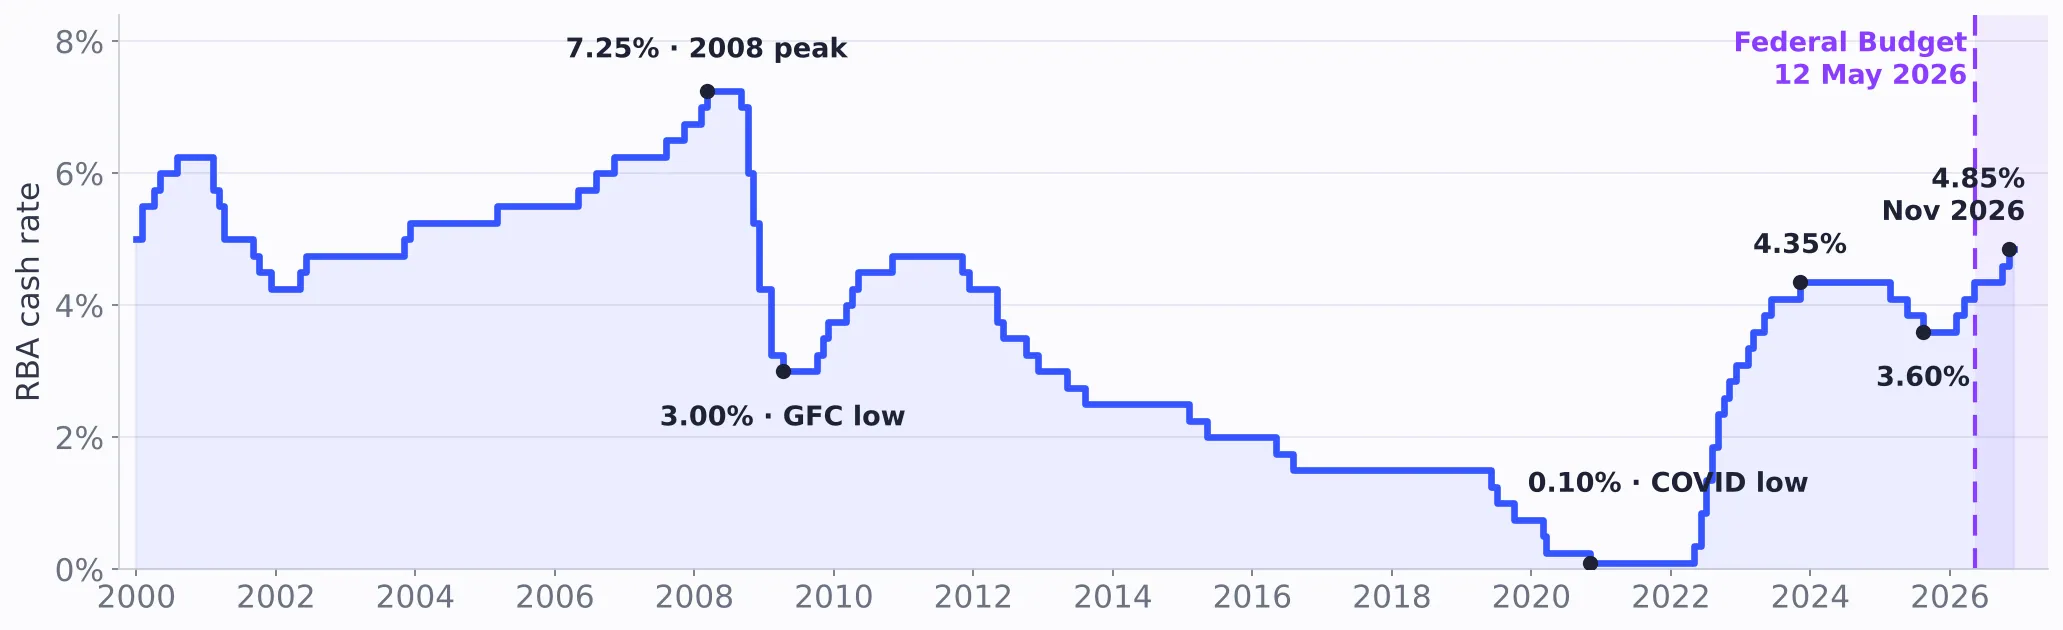
Source: RBA cash rate target (effective dates), 2000–2026.
Investor lending just had its biggest fall on record
New data, 11 November
New lending to both owner-occupiers and investors hit all-time records in the December quarter 2025, above even the 2021 boom in dollar terms. Both peaked just as rates started rising.
Investors then fell away. Investor loans dropped 10.2% in the June quarter, then 32.3% in the September quarter to $24.7 billion, the first full quarter after the budget. That is the largest quarterly fall since the ABS series began in 2002, and 42% below December’s record. By number, 35,301 investor loans were written, 38.5% fewer than a year ago and the fewest since late 2020.
Owner-occupier lending fell a more modest 5.3% to $56.5 billion, and first home buyer loans fell 8.6%. Total new home lending fell 15.5% to $81.2 billion, also a record fall. The ABS says investor activity is “being influenced by factors beyond increasing borrowing costs”, which points to the budget’s tax changes.
A third fewer investors are borrowing than a year ago. That means less competition for your clients, especially for established homes.
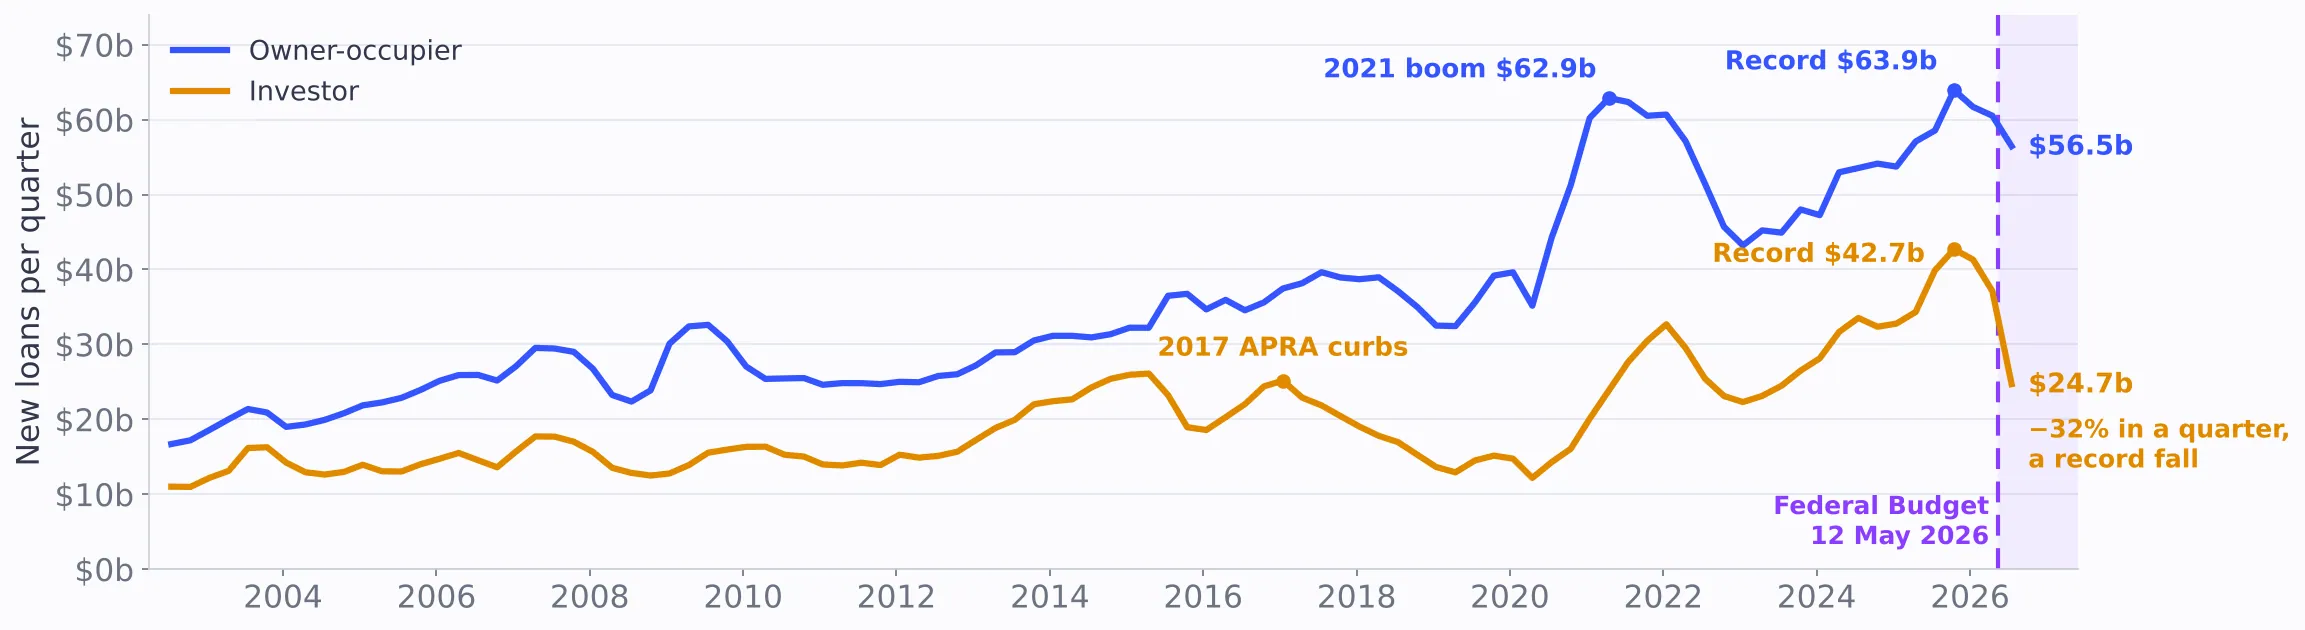
Source: ABS Lending Indicators, seasonally adjusted, excluding refinancing. September quarter 2026 figures released 11 November 2026.
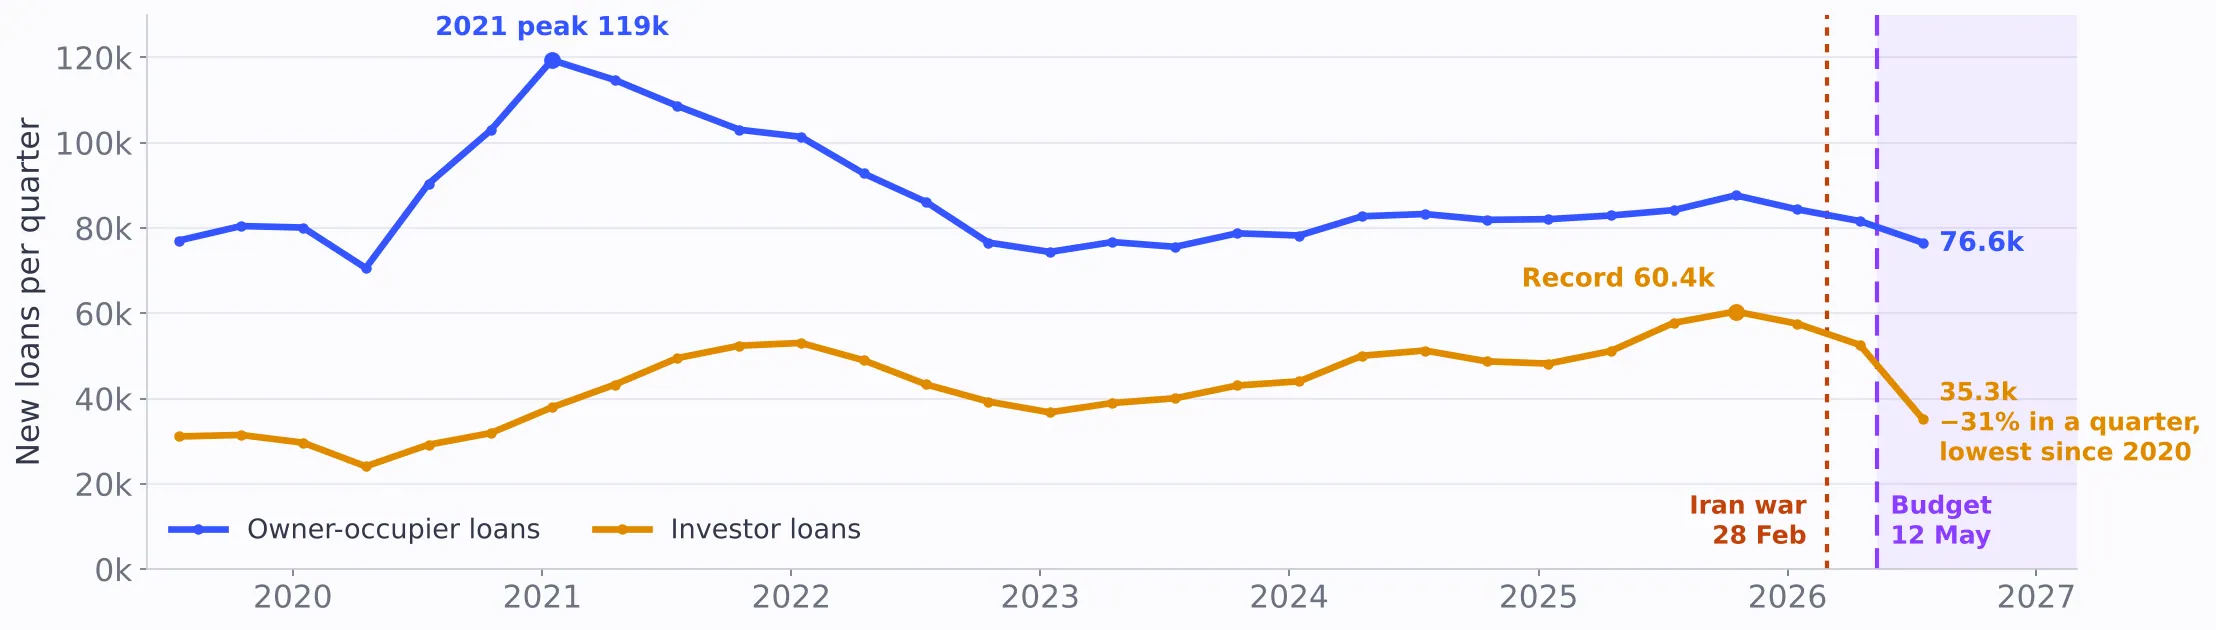
Number of new loans, excluding refinancing. Source: ABS Lending Indicators, seasonally adjusted. Investor loan numbers are available from 2019.
The refinancing boom has peaked
External refinancing reached a record $68.5 billion in the March quarter 2026, above even the 2023 “fixed-rate cliff” in dollar terms. It dipped 2.1% to $67.1 billion in the June quarter, the first fall in two years.
New for the September quarter: the number of loans refinanced fell 5% to 97,618, the fewest since late 2024. Owner-occupier refinances fell to 63,475 and investor refinances to 34,143. By number, the real peak was the 2023 fixed-rate cliff, at 117,500 in a quarter; 2026 looks bigger in dollars only because loans are bigger.
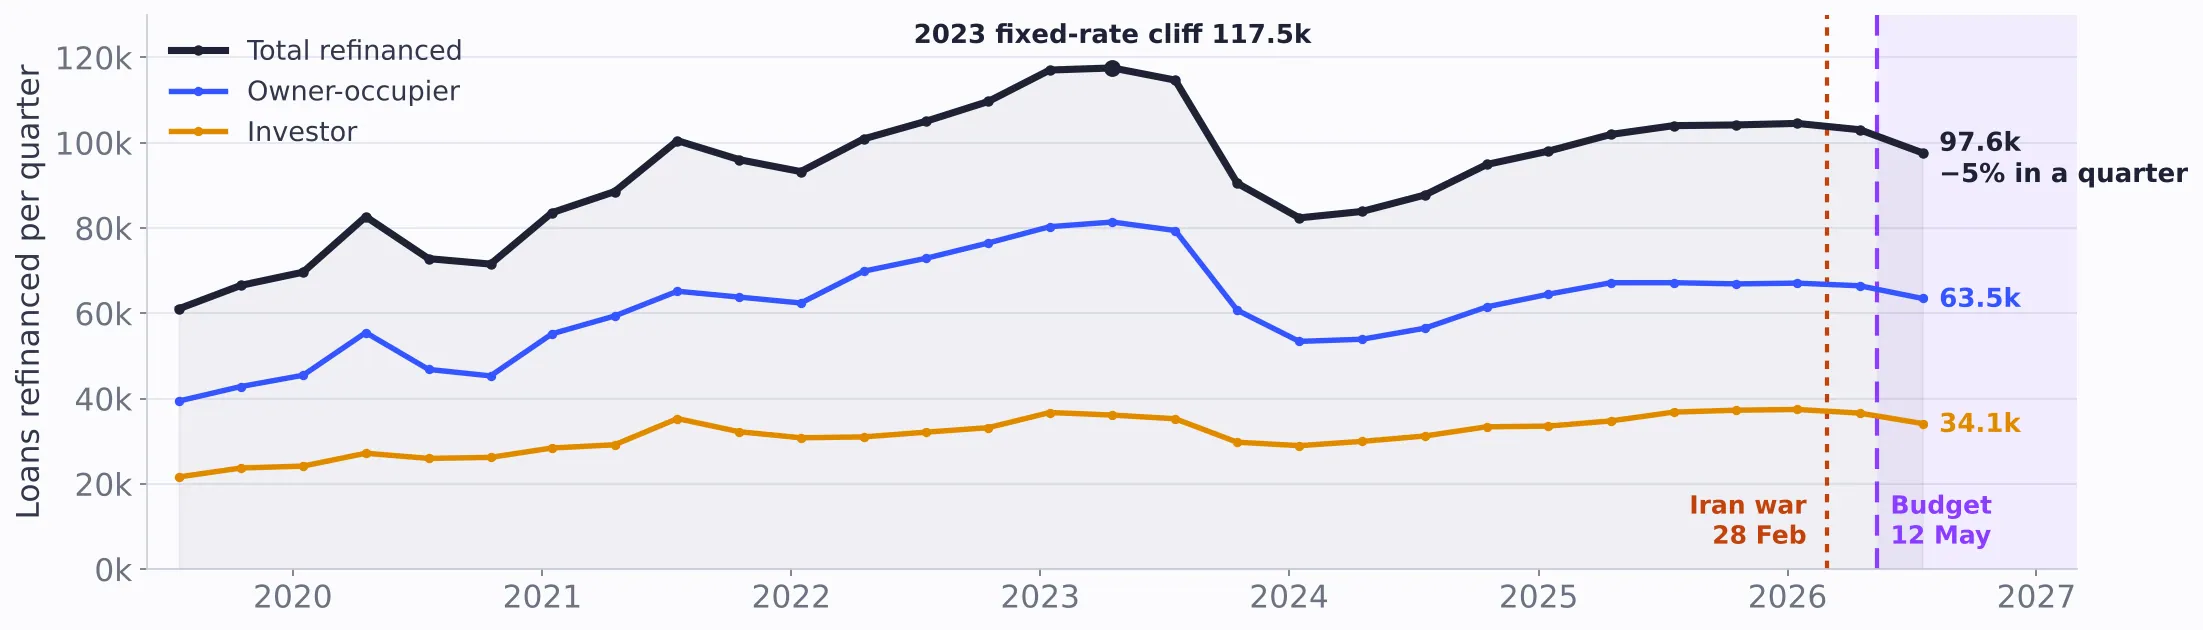
Number of external refinances, owner-occupier and investor. Source: ABS Lending Indicators, September quarter 2026, released 11 November 2026.
That matters because refinancing is the first pressure valve. Owners facing higher repayments shop for a better rate. Many have already done that, and for some the next step is to sell. That shows up in the listings numbers below.
Buyers are nervous, and the surveys show it
The Westpac–Melbourne Institute surveys show all three key measures trending down:
| Measure (October 2026) | Reading | Change on a year ago |
|---|---|---|
| Consumer sentiment | 80.4 | −13% |
| Time to buy a dwelling | 88.4 (low of 72 in May) | −8% |
| House price expectations | 115.1 | −33% |
On these indexes, 100 is neutral. House price expectations are still above 100, so more people expect prices to rise than fall, but far fewer than a year ago, and the reading is below its long-run average of about 130. Westpac puts the unease down to uncertainty over interest rates and tax policy. When fewer people expect prices to rise, fewer feel they have to buy now.
What the May 2026 budget changed for investors
The 12 May 2026 Federal Budget announced two changes that go to the heart of investor strategy. Neither takes effect until 1 July 2027, but investor lending fell straight away.
| Change | What was announced | What it means for clients |
|---|---|---|
| Negative gearing | From 1 July 2027, limited to new builds. Properties held before 7:30pm on budget night keep the current rules. | Established homes bought now won’t be negatively geared from mid-2027. New builds still will. |
| Capital gains | The 50% discount is replaced by CPI indexation and a 30% minimum tax, for gains after 1 July 2027. New-build investors can choose either. | Holding periods, yield and the new-build question all move up the list in investor briefs. |
Owner-occupiers are not affected by either change. That creates a window for home buyers, who are now competing against fewer investors for the same established stock.
For investor clients, the brief needs rethinking, not shelving. The conversation moves toward yield, new builds and longer holds.
This is general information, not tax advice. Clients should confirm how the changes apply to them with their accountant.
Tip: the budget did not start the slowdown. Sentiment and investor lending were already turning before 12 May, and three rate rises had already landed. When a client asks “should we wait until the budget dust settles?”, the honest answer is that the dust is rates, inflation and confidence too, and none of those has turned yet.
Cause and effect on one timeline
Put the indicators side by side and the sequence is clear. Inflation turned first, from mid-2025. The RBA followed with rate rises from February 2026. Investor lending peaked in December and has since fallen 42%, sentiment cracked in April, and sales peaked in late 2025 and have been falling since. Listings did not collapse, which is why stock is building and buyers have more choice.
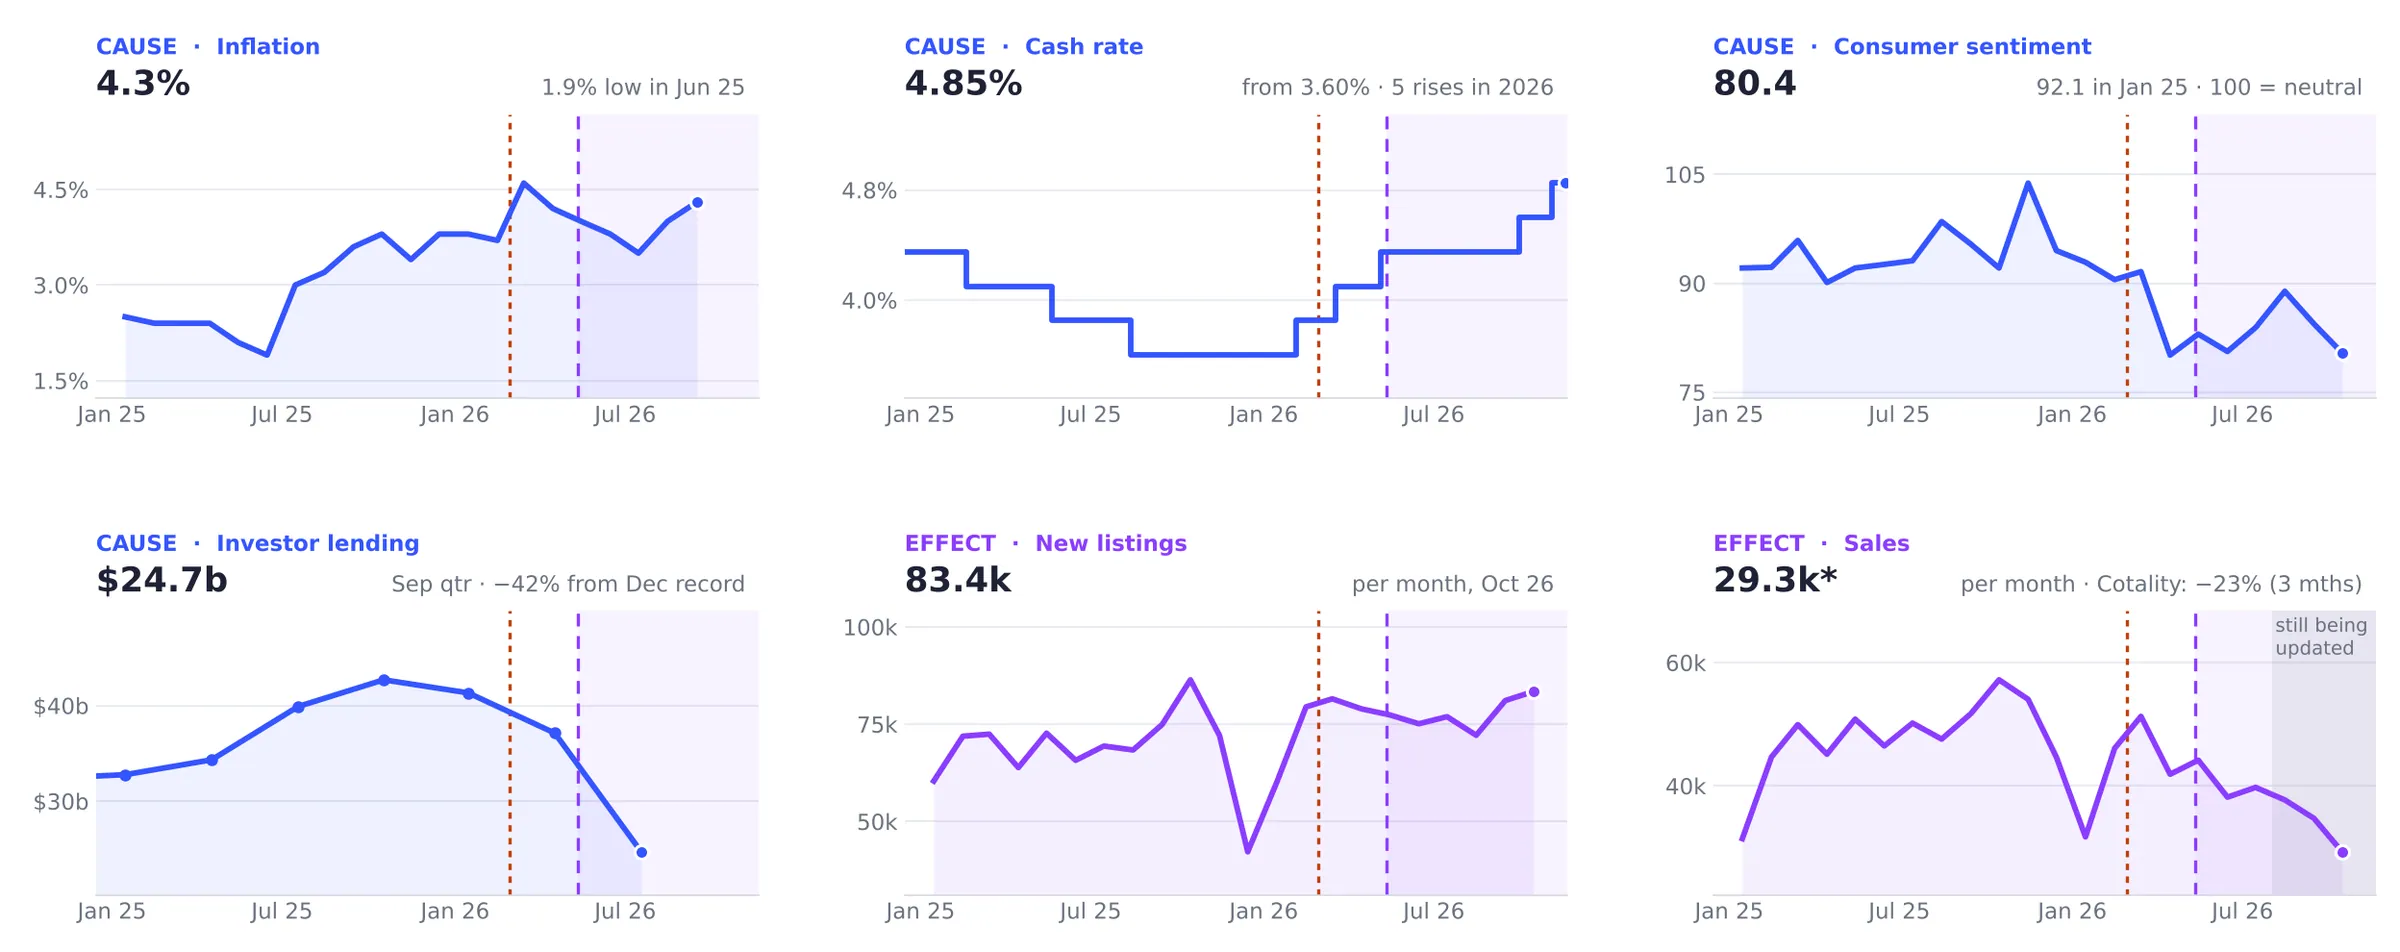
Sources: RBA, ABS, Westpac–Melbourne Institute, national sales data. Recent sales are still being updated, so the latest months will revise up. Cotality has sales down 23% over the three months to October.
Spring 2026: listings came, buyers didn’t
In a normal spring, sales climb with listings. From August to October 2025, sales rose 20%. This year sales fell from August, even as new listings rose 16%.
| National measure | Latest | A year earlier |
|---|---|---|
| Sales, September | 35k | 52k (−33%) |
| New listings, October | 83k | +16% since August, normal for spring |
| Median days on market, October | 41 | 29 (+12 days) |
| House median, October | $926k | $965k (−4%) |
September is used for sales because October’s count is still being updated. Cotality’s figure for the three months to September is −19%. National days on market and median price are state medians weighted by sales.
Listings: more choice for your clients
Supply did not dry up. Vendors kept coming to market through winter and spring, with new listings from June to October up 6.5% on the same months of 2025. With vendors still listing, buyers should keep having more choice well into 2027.
Sales: fewer buyers competing for each home
Sales fell every month after the budget, from about 38,000 in June to 29,000 in October, while the same months last year climbed to 57,000. Fewer active buyers means fewer people bidding against your client. Until confidence returns, sales are likely to stay well below 2025 levels through summer.
Days on market: more room to negotiate
Days on market had been tightening for two years, down to 27 in February and March 2026. Since the budget it has climbed every month, to 41 in October. Averaged over June to October it was 39 days, against 31 a year earlier.
A vendor at day 40 is in a different frame of mind from one at day 10. Longer campaigns usually come before price adjustments, so expect more vendors to be open to offers.
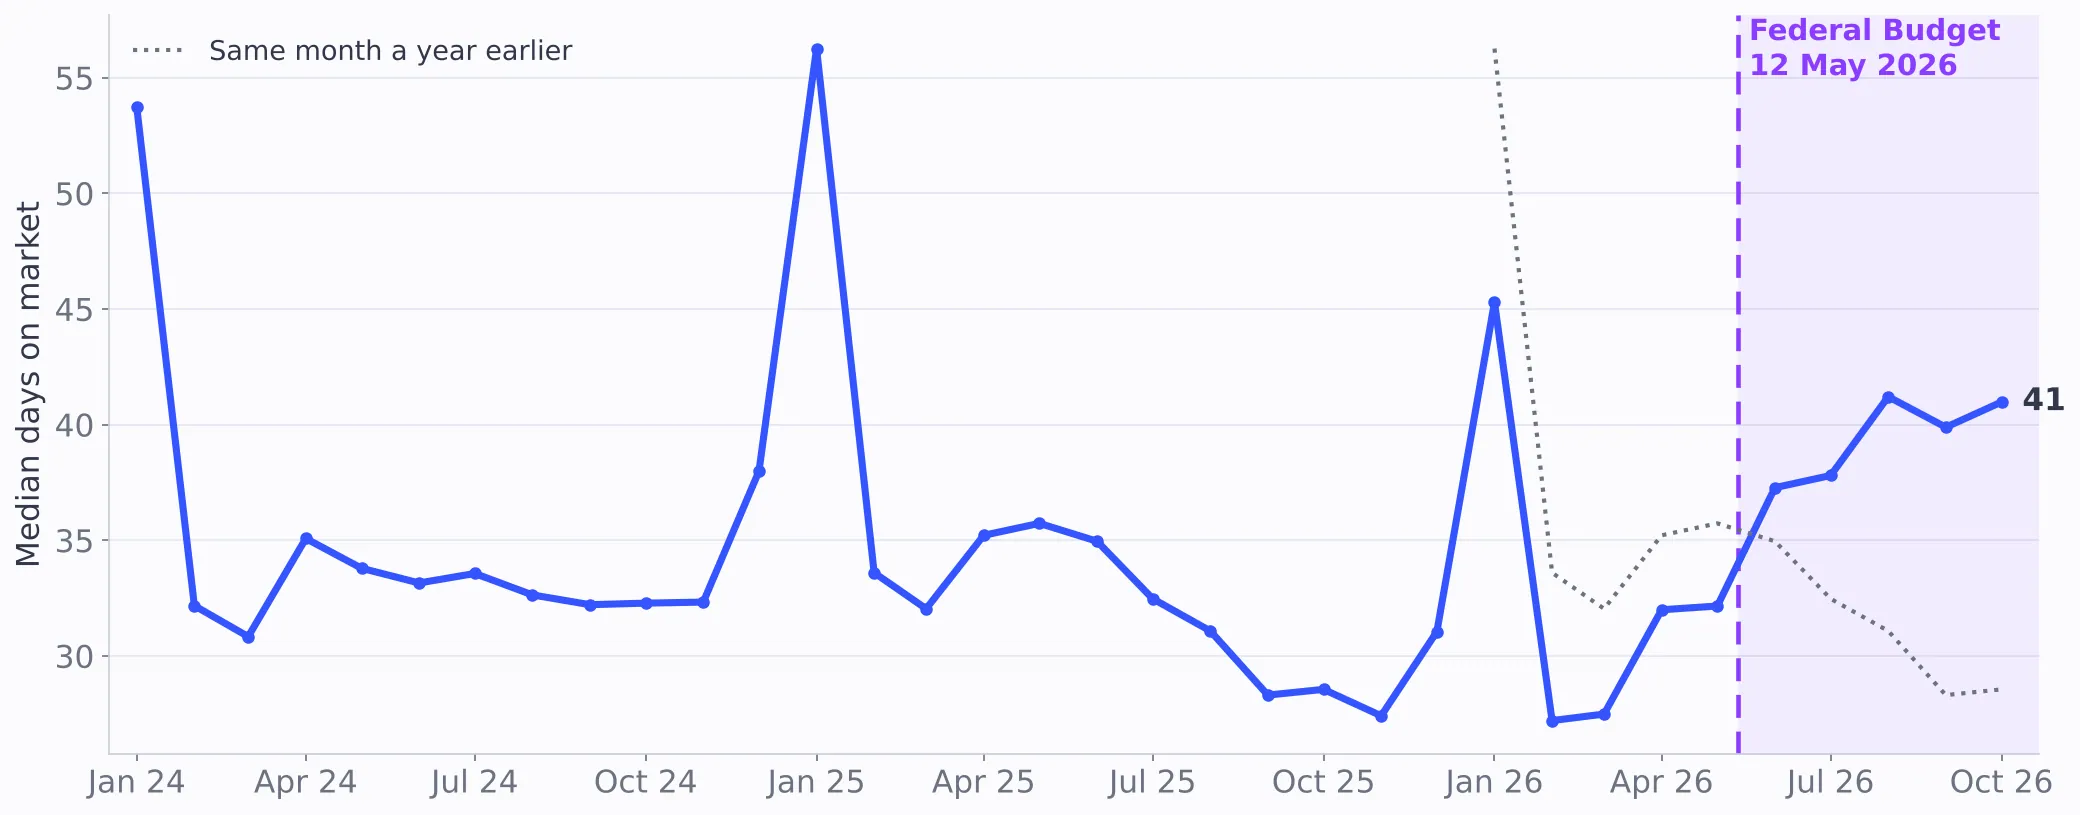
Source: monthly market stats, state medians weighted by sales. January spikes are the usual holiday effect.
Listings per sale: 2.2 for every sale
Divide new listings by sales and you get the clearest single measure of who holds the leverage. From June to October 2026 the ratio averaged 2.2, against 1.4 a year earlier. In October alone it was 2.8, against 1.5. That gap is unsold stock building up.
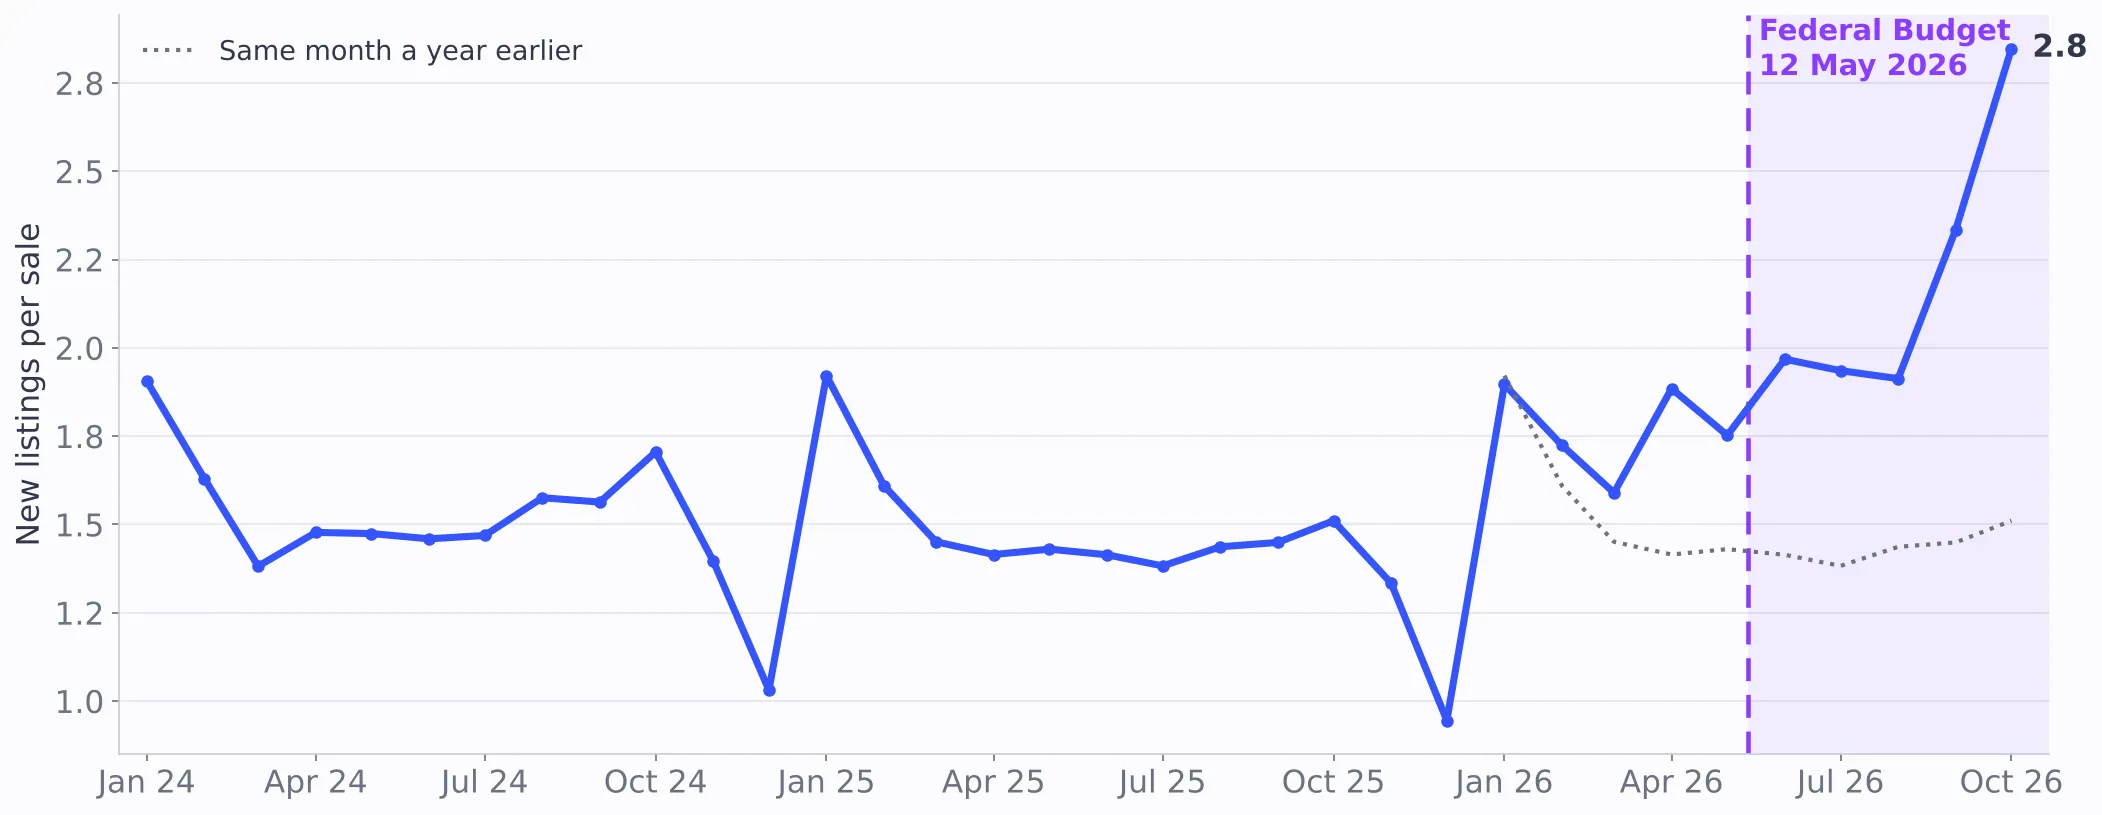
Source: monthly market stats. December dips are the seasonal low in new listings.
Until this falls back toward 1.5 listings per sale, the balance of power stays with buyers.
Prices are following
Sales and days on market moved first; prices are now catching up. On a three-month average, the national house median peaked at $984k in April 2026 and has fallen about 8% since, to $909k in October. Cotality’s index tells the same story: values fell for a seventh straight month in October and are now 6.7% below the March peak, about $63,400 off the median dwelling value.
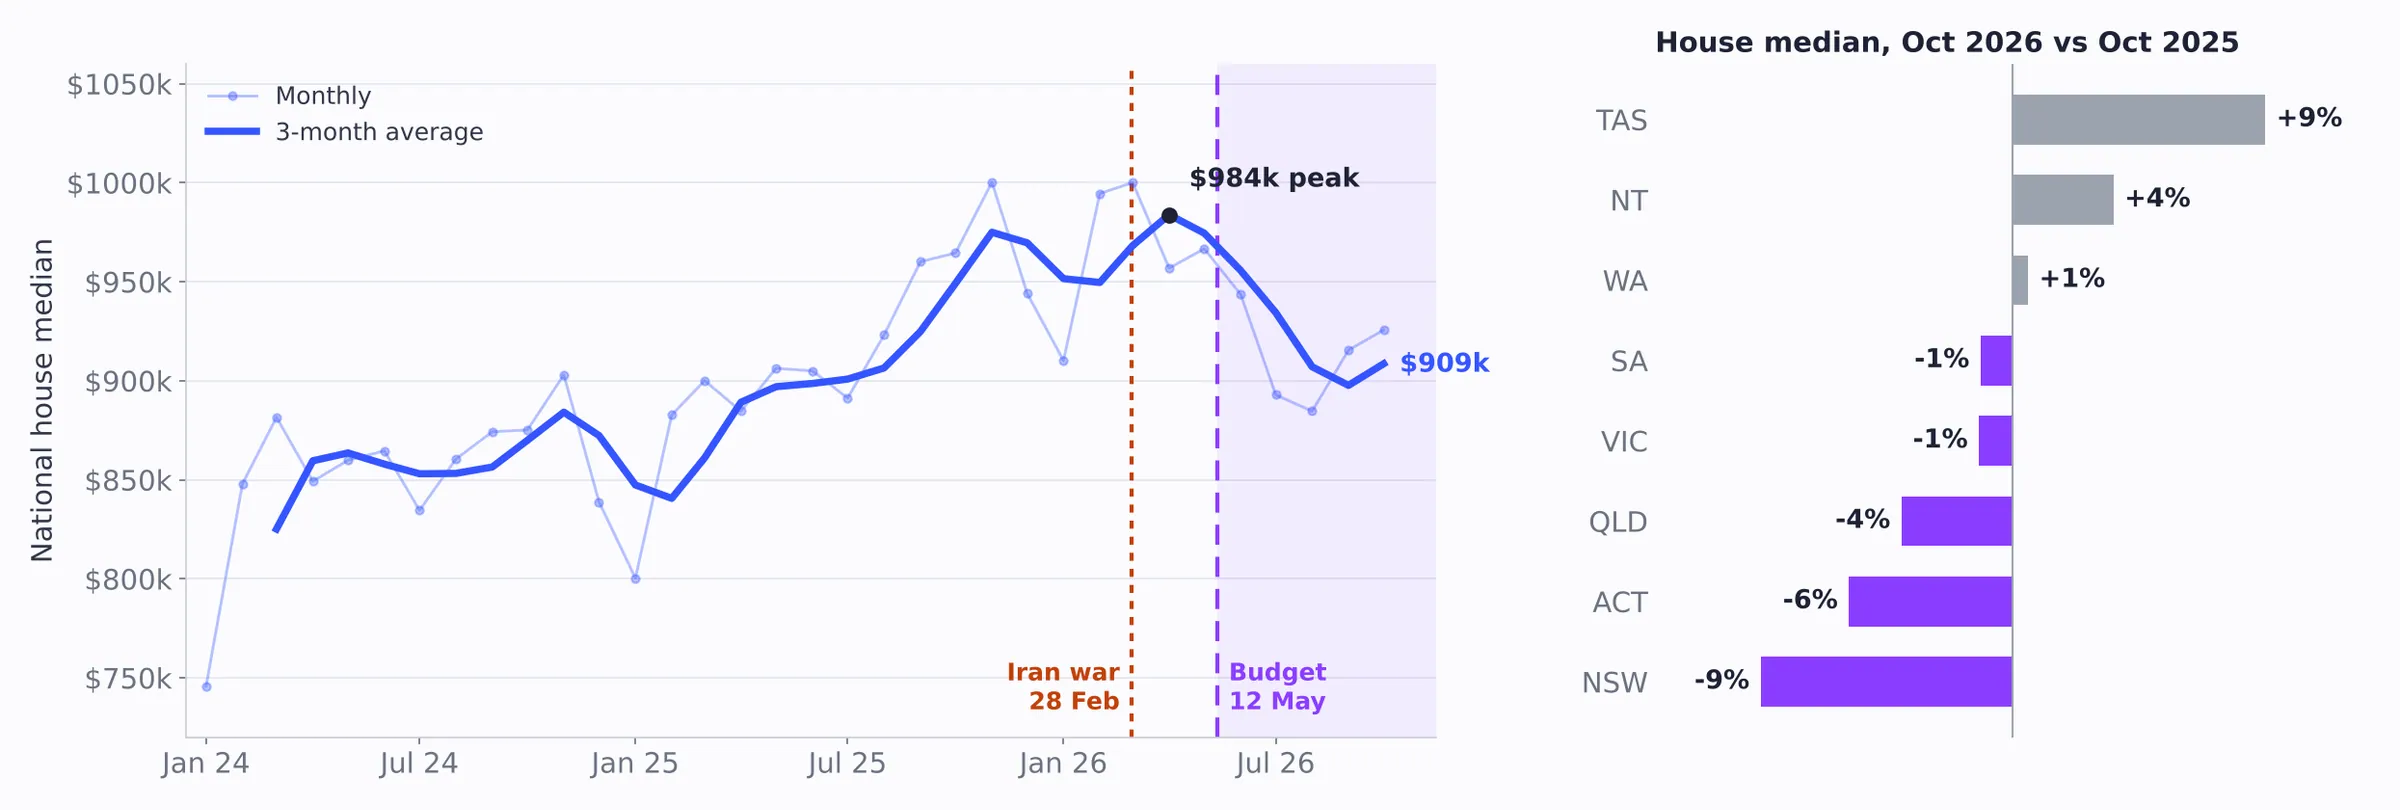
Source: monthly market stats by state, house medians. National = state medians weighted by sales. Medians shift with the mix of homes sold, so use the three-month line rather than single months.
NSW is down most, 9% on a year ago, then the ACT (−6%) and Queensland (−4%). Tasmania (+9%) and the NT (+4%) are still up, off a lower base.
Units are holding up better than houses. Nationally, unit medians are down 2% against 4% for houses. In Queensland, units are still up 1% while houses are down 4%, and NSW houses are down 9% against 3% for units. Adelaide is the exception, with units down 5%.
Insight: comparable sales from late 2025 and early 2026 now overstate value. In a falling market, price offers off the most recent sales, not the peak, and expect the vendor’s agent to anchor on the older evidence. Houses are where the bigger discounts are right now.
Auctions: four in ten are selling
In the week ending 1 November 2026, the combined capital city final clearance rate was 40.7%, the lowest since April 2020. In the same week of 2025 it was about 66%. Every capital is down.
| Capital | Same week 2025 | Week ending 1 Nov 2026 | Change |
|---|---|---|---|
| Sydney | 66% | 45% | −21 pts |
| Melbourne | 61% | 44% | −17 pts |
| Canberra | 62% | 40% | −22 pts |
| Adelaide | 77% | 35% | −42 pts |
| Perth* | 67% | 33% | −33 pts |
| Brisbane | 69% | 24% | −45 pts |
| Combined capitals | 66% | 41% | −25 pts |
Source: Cotality final clearance rates, week ending 1 November 2026. 2025 city rates derived from Cotality’s year-on-year changes. *Perth: 24 auctions, a small sample.
Fewer vendors are even trying: auction numbers were down 43.5% on a year ago in the week ending 8 November. Most auctions now pass in or are withdrawn, and those vendors negotiate afterwards. That is where buyers win. Track the properties that passed in and approach the agent early in the following week.
Where buyers hold the most leverage, state by state
Before the budget, most states were level with or ahead of 2025. Since June, sales in every state are down between 17% and 35%. The same break shows in every state’s chart.
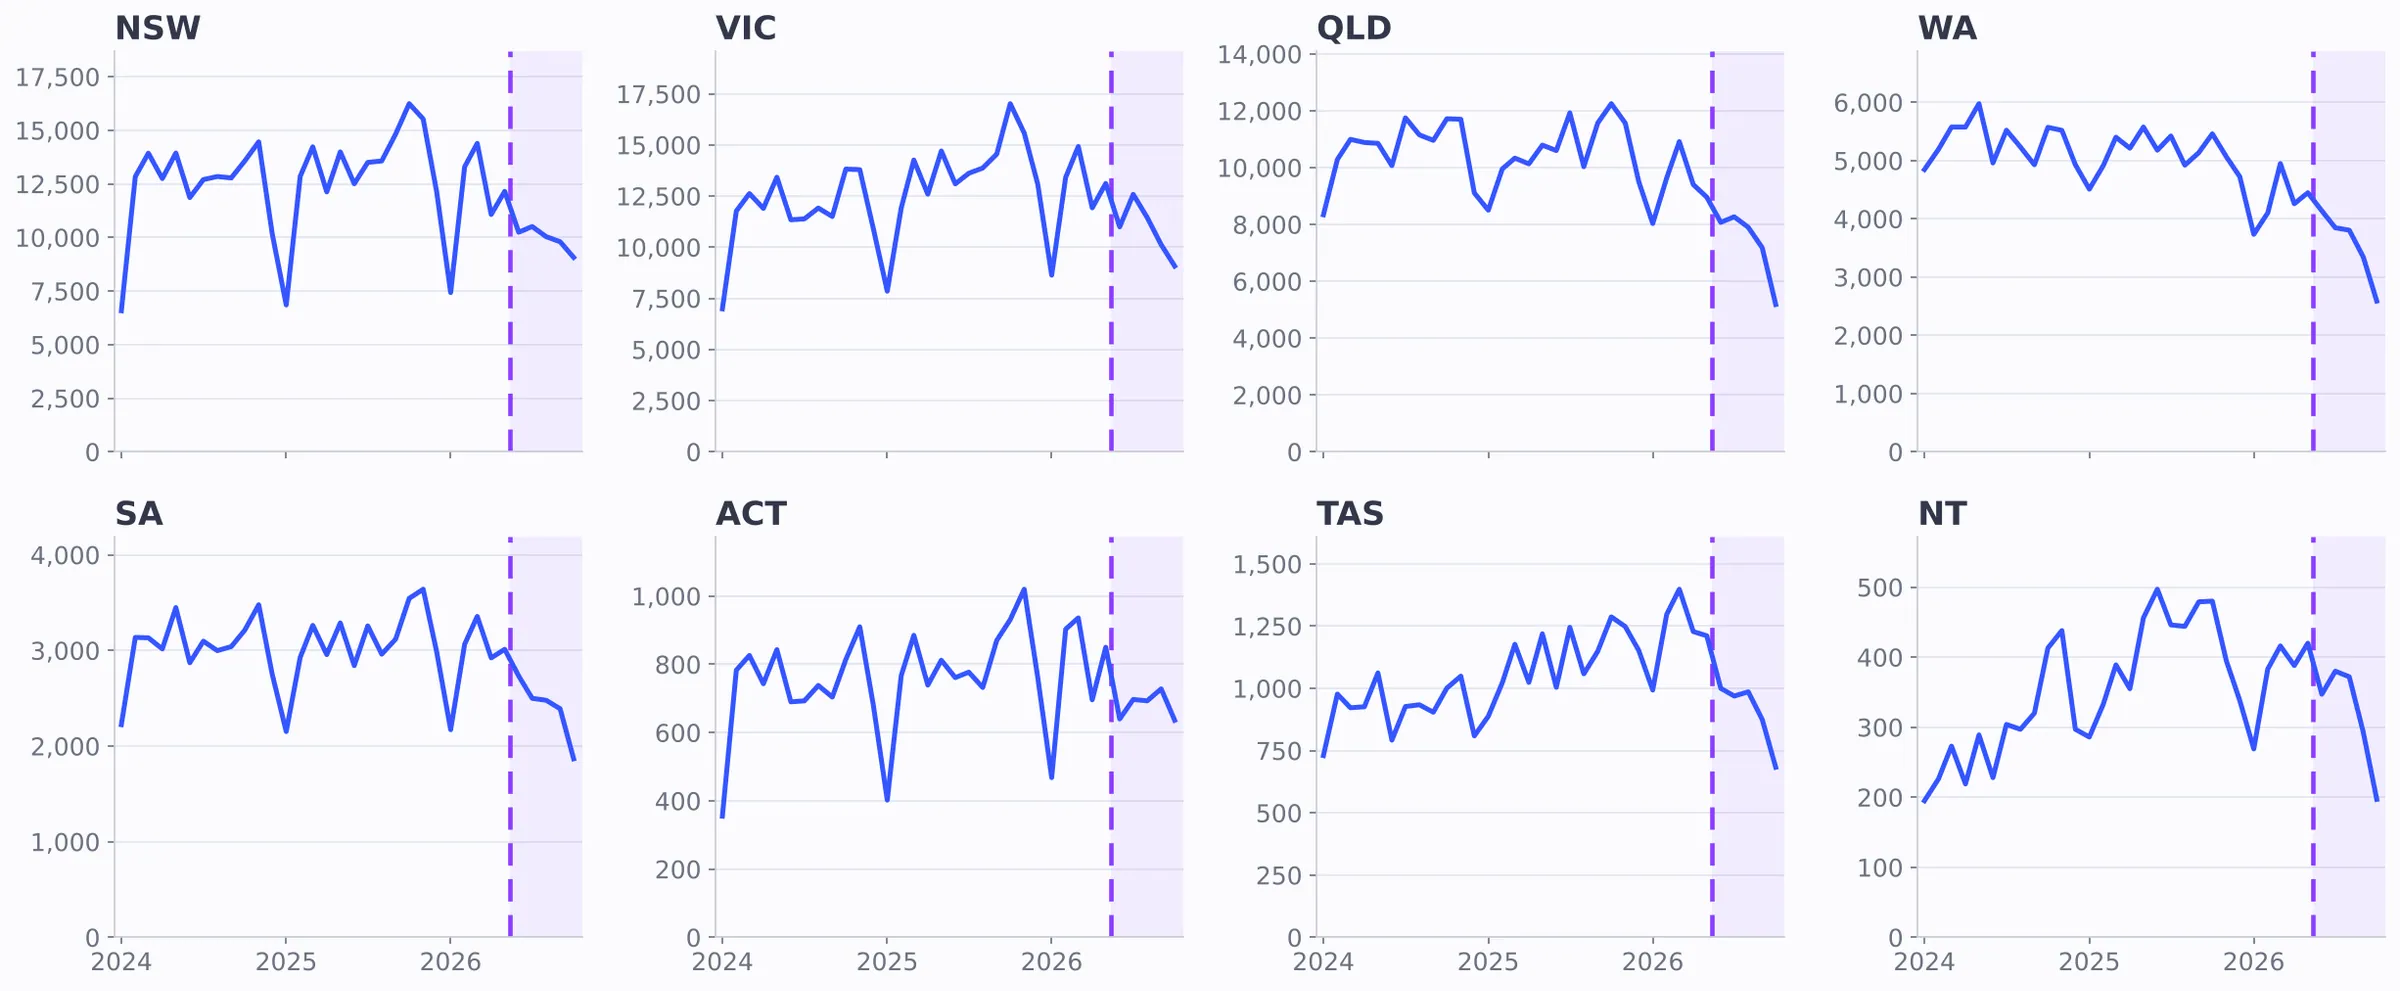
Source: monthly market stats by state. Each chart has its own scale.
| State | Sales Jun–Oct | Listings Jun–Oct | Days on market | Listings per sale | House median, Oct |
|---|---|---|---|---|---|
| QLD | −35% | +11% | 31 → 45 | 1.3 → 2.3 | $926k (−4%) |
| WA | −32% | +18% | 36 → 47 | 1.4 → 2.5 | $880k (+1%) |
| NT | −32% | −9% | 16 → 27 | 1.0 → 1.4 | $705k (+4%) |
| NSW | −30% | 0% | 31 → 40 | 1.4 → 2.0 | $1.09m (−9%) |
| VIC | −25% | +6% | 29 → 35 | 1.6 → 2.2 | $810k (−1%) |
| SA | −24% | +12% | 24 → 31 | 1.4 → 2.1 | $850k (−1%) |
| TAS | −21% | +4% | 49 → 35 | 1.1 → 1.4 | $700k (+9%) |
| ACT | −17% | −7% | 34 → 40 | 1.2 → 1.4 | $950k (−6%) |
| Australia | −29% | +6% | 31 → 39 | 1.4 → 2.2 | $926k (−4%) |
Source: monthly market stats. Changes are against the same months of 2025. Days on market and listings per sale: Jun–Oct 2025 → Jun–Oct 2026. House medians: October 2026, change on October 2025.
Queensland: the biggest swing to buyers
Queensland shows the clearest picture of all three lines moving together: listings up 11%, sales down 35%, and days on market rising every month since the budget, to 51 in October. October sales were 5,182, against 12,248 a year earlier. With campaigns lengthening every month, expect price flexibility to show up before any recovery does.
Western Australia: more stock waiting than anywhere else
WA has the highest ratio of listings to sales of any state since the budget, at 2.5. Sales were already softening before May, but the drop steepened after it: October sales were 2,587, against 5,459 a year earlier. WA’s house median is still roughly flat, which suggests prices there have further to adjust. This much stock will take months to clear, so buyers can afford to be patient and selective.
New South Wales: stock holding, buyers thinning out
NSW listings are level with last year, but sales are down 30%, and October sales were 9,068 against 16,241 a year earlier. NSW has the largest price fall of any state, with the house median down 9% to $1.09m. Units are down only 3%. If listings keep outpacing sales, expect longer campaigns and more vendors open to offers into summer.
Victoria: plenty of choice, fewer buyers at the table
Victoria already had the most listings per sale before the budget, at 1.6, and that has risen to 2.2. October sales were 9,077, against 17,017 a year earlier. Victoria’s deep pool of stock is likely to keep buyers in control into 2027.
South Australia: still the quickest market, but slowing
SA is still the quickest-selling state at 31 days, but the same pattern is there: listings up 12%, sales down 24% and longer campaigns. October sales were 1,867, against 3,544 a year earlier. Well-priced homes will still sell fast, but stale, overpriced listings will start to stand out.
ACT: the steadiest market
In the ACT, listings fell as well as sales, so the stock build-up is small at 1.4 listings per sale. October sales were 636, against 931 a year earlier. Expect a slow, steady market rather than big discounts. Good stock will still draw competition.
Tasmania: the exception
Tasmania breaks the pattern. Days on market are shorter than last year, 35 against 49, even though sales fell 21%. It started from a very long base and had a strong first half of 2026. Treat it with care, as it is a small market. If sales keep falling, Tasmania is likely to follow the other states.
Northern Territory: from hottest to cooling fast
The NT had been the hottest market in the country, with listings selling in about 16 days. Since the budget it has cooled faster than anywhere, with October sales at 197 against 480 a year earlier. The numbers are small, but buyers here may have the best leverage they have had in years.
How buyer’s agents can use this market
A nervous market is a buyer’s market. Less competition, more stock and longer campaigns are exactly when a good buyer’s agent earns their fee. Four steps turn the data into results for clients.
1
Read the suburb, not the headline
Check listings, sales, days on market and prices for your client’s target suburbs. National trends hide big local differences.
2
Know the agent
Find who is listing and selling in the area now, and how far their campaigns usually move on price.
3
Know the vendor
Ownership length, purchase price, rental history and listing history tell you how much room they have.
4
Price off the evidence
Use recent comparable sales and more than one estimate before you make the offer.
1. Read the suburb, not the headline
The state numbers above show the direction, but every brief is local. Stash covers listings, sales, days on market and price trends for any of 15,000 suburbs, with heatmaps and filters to shortlist markets that fit a buyer’s strategy. You can also send clients a branded suburb market update, so they see the same evidence you do.
2. Know the agent, because agents are changing
Stash’s own office data shows how much the agent landscape has moved. Across 2,542 active residential offices there are 2,714 fewer agents than a year ago, down 7.6% from 35,801 to 33,087. About half of all offices (1,295) lost agents, and only 633 gained any. The agent who sold in your client’s suburb last year may have moved on.
Agents also differ a lot in how much prices move during their campaigns. Across 1,215 residential offices with 50 or more sales in the last 12 months, the typical office’s average price adjustment is −1.0%. But 9% of offices average 5% or more below the asking price, and 11% average 4% or more above it.
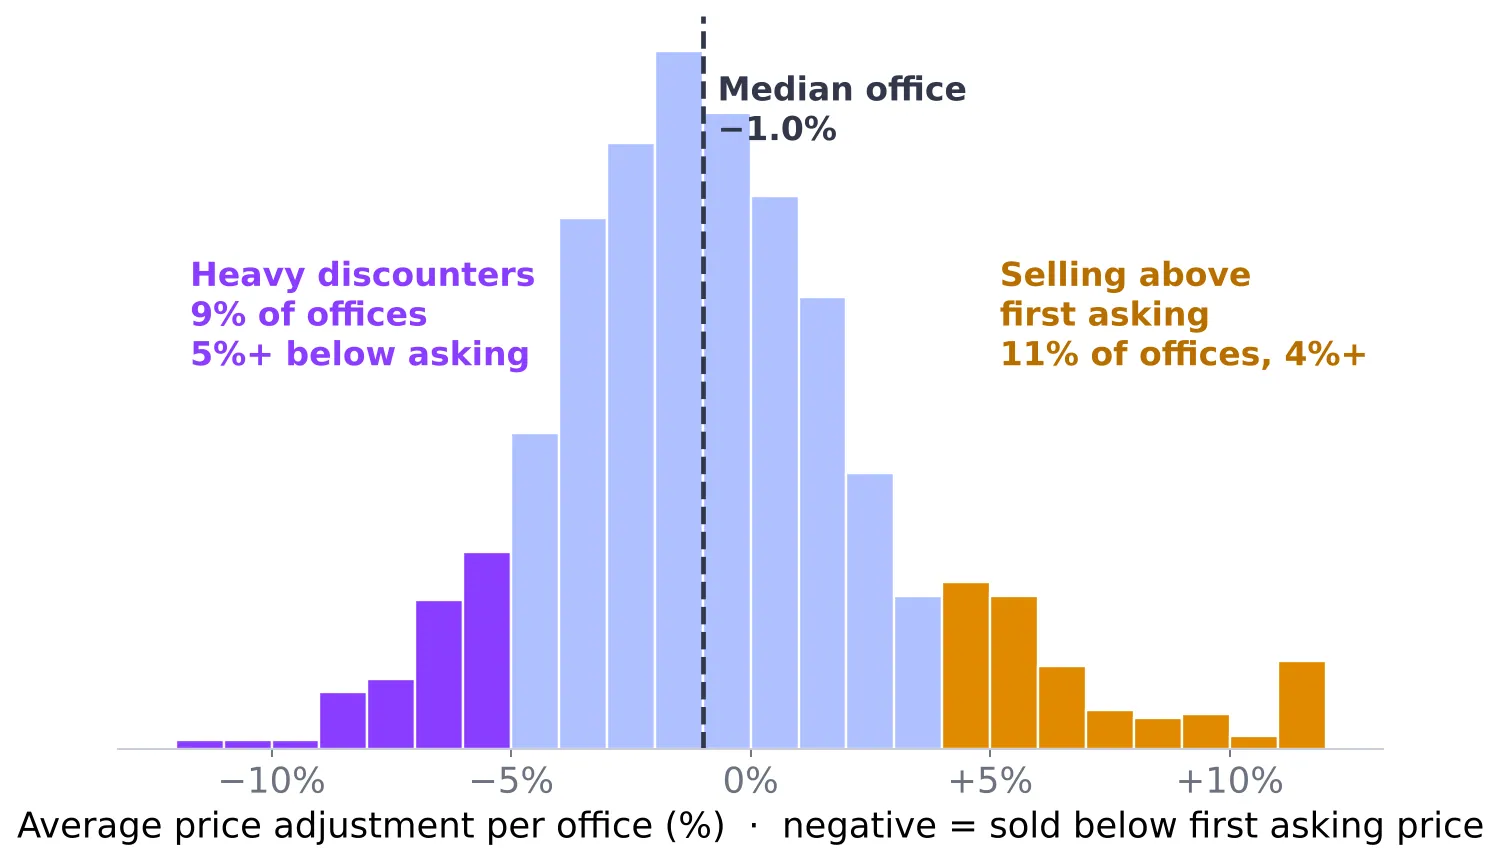
Source: Stash agency data, average price adjustment per office, last 12 months. Residential offices with 50+ sales.
If your client’s target property is listed with an office that regularly comes down 5% or more, that is negotiating room. By state, WA offices are selling above asking on average, while NT and NSW offices discount the most.
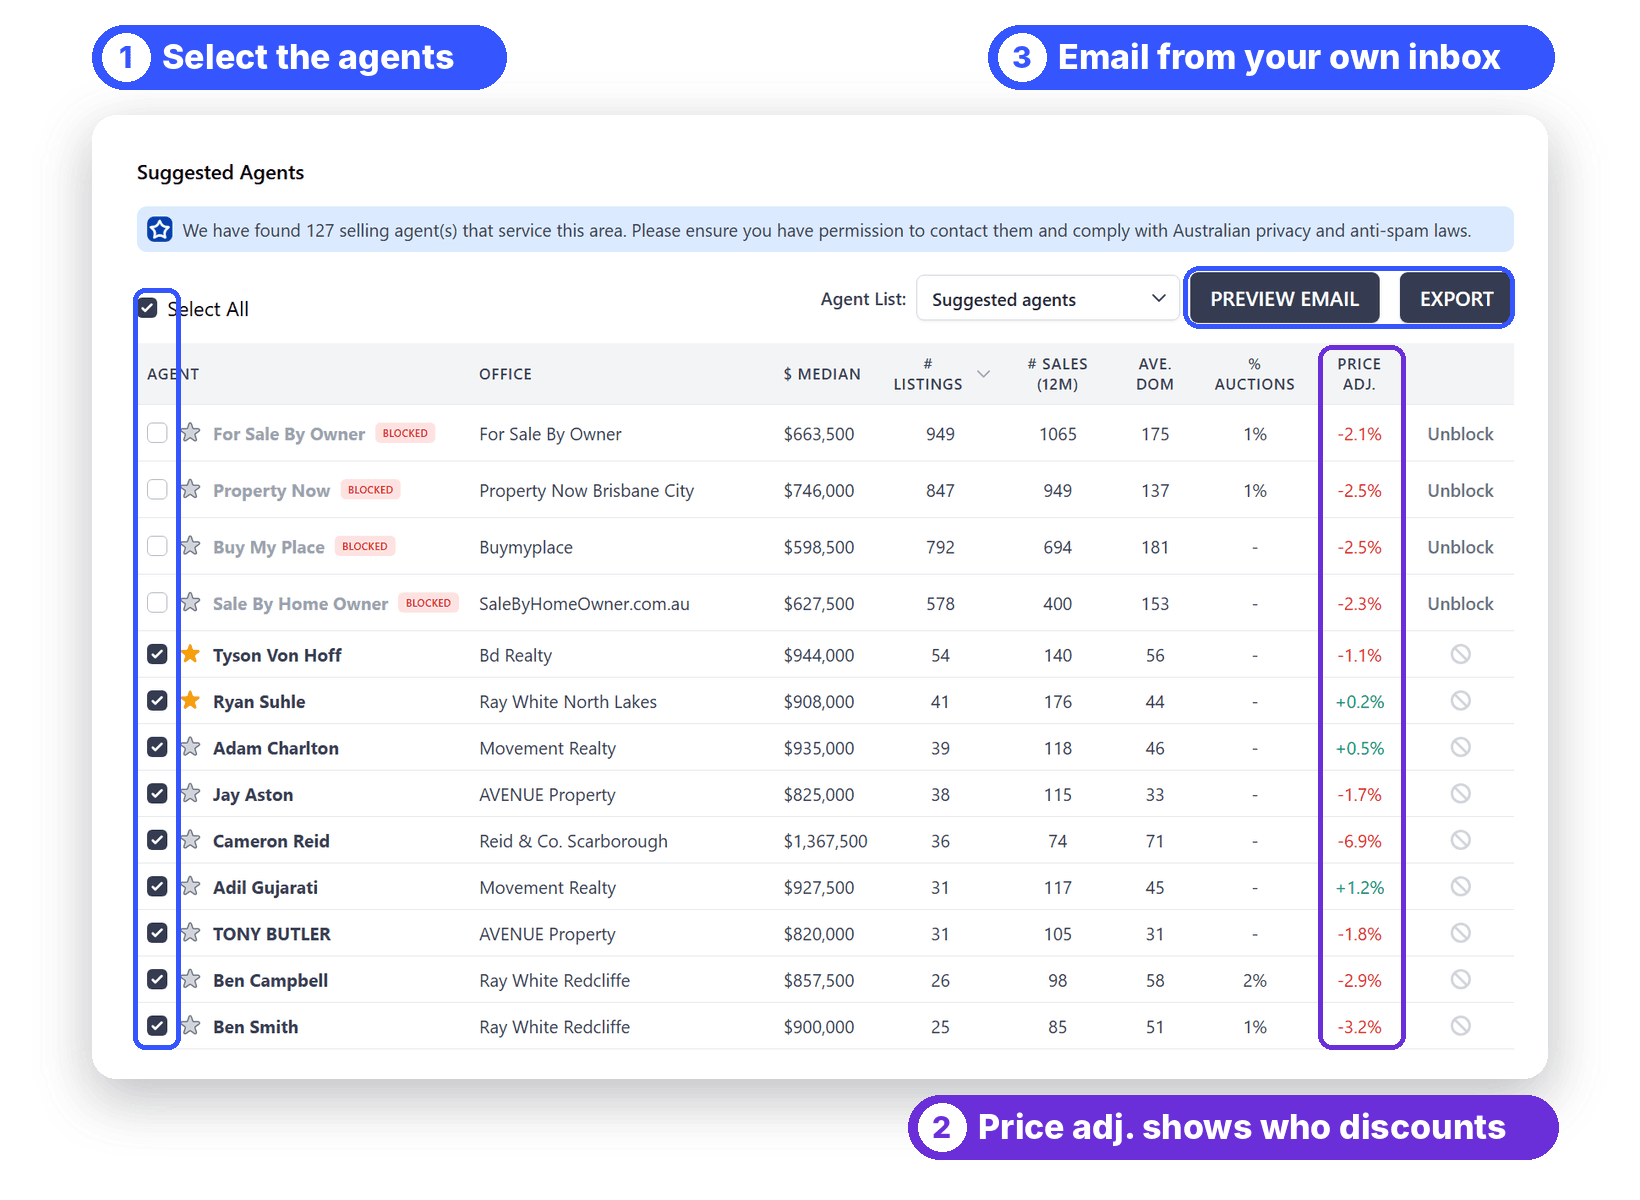
Agent Insights, in every Buyer Brief, shows the most active selling agents in your client’s target area with their price adjustment, days on market and auction rate. You can select agents and email the brief from your own inbox, so replies come straight to you, or export the list. Being the first buyer’s agent an agent thinks of is how you hear about pre-market and off-market stock first.
3. Know the vendor’s situation
The best offer starts with why the property is for sale. Pair a conversation with the selling agent with the property’s history.
| Ask the agent | Check the data |
|---|---|
| Why are they selling? | How long they’ve owned it |
| Where are they moving to: bigger, smaller, interstate? | What they paid against today’s estimate |
| Have they already bought? | Owner-occupied or rented, and when that changed |
| What settlement suits them? | Sale history |
| Any offers so far, and where? Has the guide moved? | Listing history: price cuts, previous campaigns |
Upsizers buy and sell in the same market, so a lower sale price is often made up on their next purchase. Long-term owners have equity to give. A vendor who has already bought may be carrying two loans and want certainty more than the last dollar.
For example, a property bought in 2007 for $620,000 with an estimate today of $1.56 million carries roughly $940,000 of potential equity. If it was rented out in 2024 and is now owner-occupied, it is worth asking whether the owners moved back in to sell.
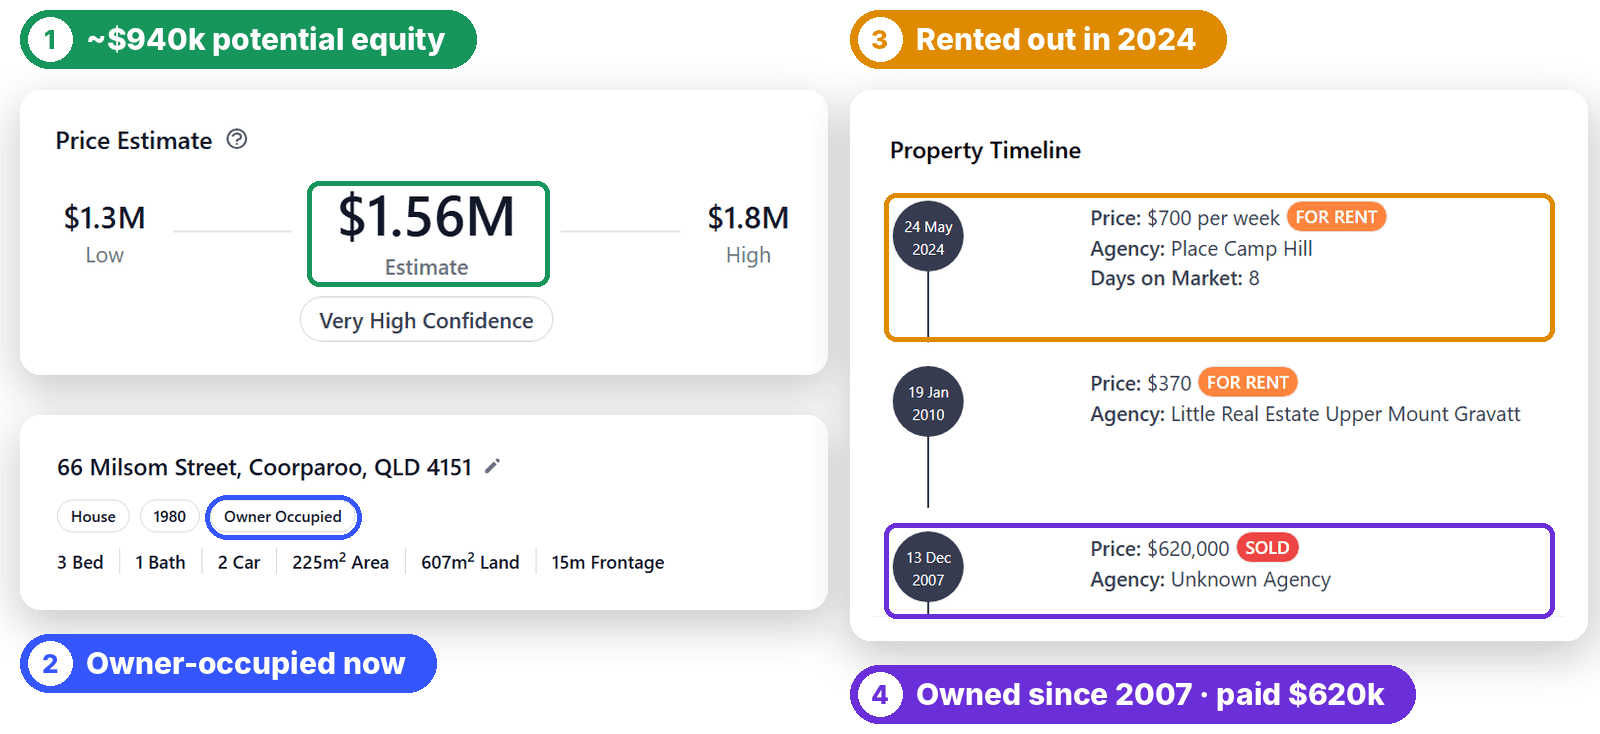
One Stash property page shows the estimate, current occupancy, and the sale and rental history: (1) about $940k of potential equity, (2) owner-occupied now, (3) rented out in 2024, (4) owned since 2007, bought for $620k.
4. Price off the evidence, three ways
In a falling market the asking price matters less and the evidence matters more. Stash gives you three ways to estimate a price before you offer, from fast to in-depth:
| Method | What it does | Best for |
|---|---|---|
| Stash AVM | An instant estimate on any property, with a confidence score and price range. | A quick first read |
| Stash AI | Click “Refine this estimate” and Stash AI picks the best comparable sales, weighs them and gives a value range. | Weighing the comps |
| Claude + Stash | Connect Stash to Claude and work through comparable sales, quick valuations and negotiation notes in the chat. | Digging deeper and planning the offer |
On one Coorparoo, Queensland house, the three reads were: AVM $1.56M (very high confidence, range $1.3M–$1.8M), Stash AI $1.50M (medium-high confidence, range $1.44M–$1.56M) and Claude with Stash data $1.52M from four comparable sales, with a suggested opening offer of $1.45M.
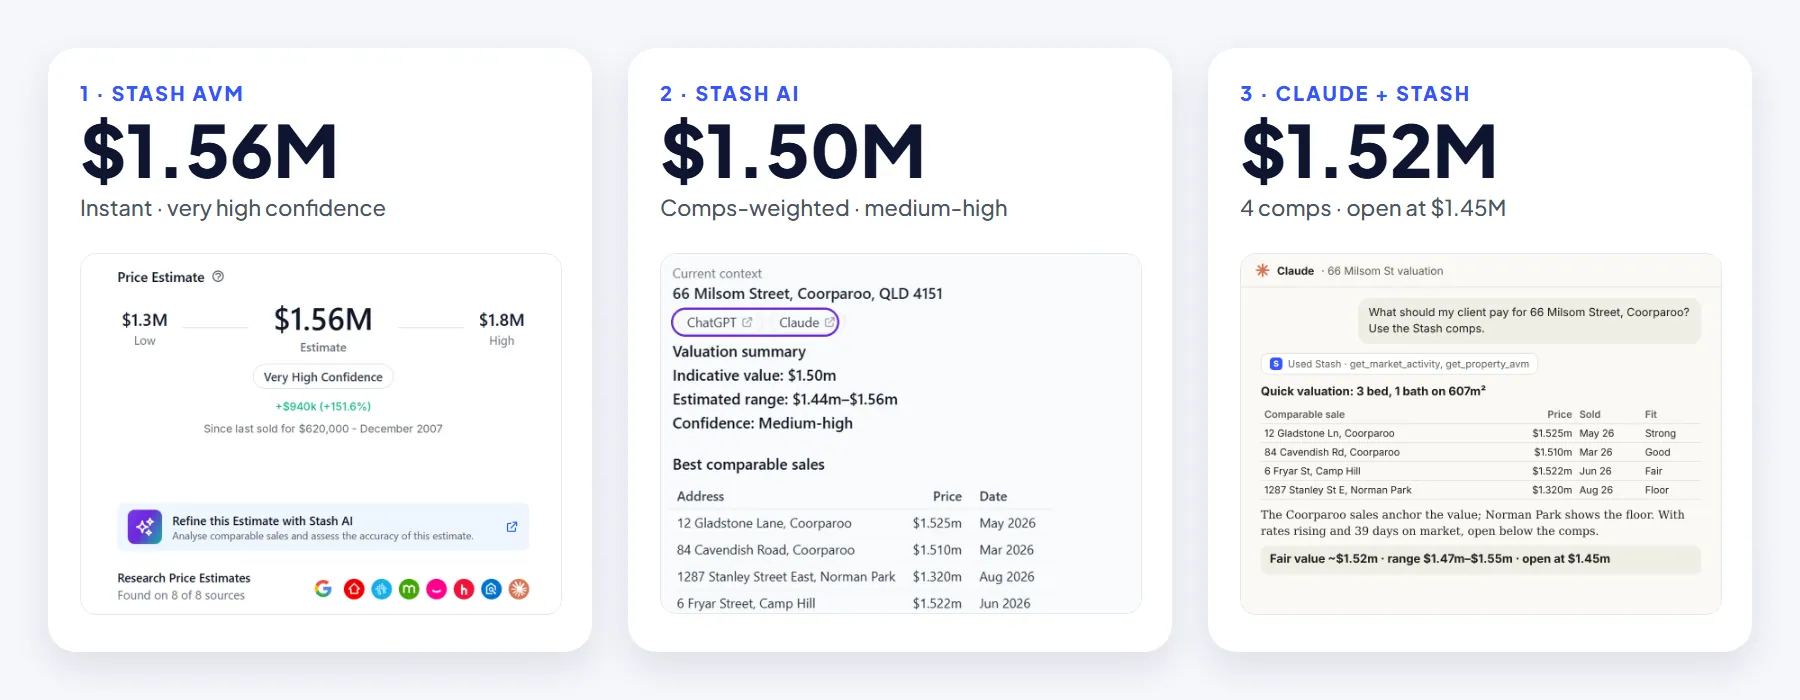
The AVM sits at the top because it is a model across the whole market. The two comps-based reads land within $20,000 of each other. When the three agree, that is confidence for an offer. When they differ, that is the conversation to have with your client about which evidence to trust.
None of these is a formal valuation. They are market estimates to support your judgement and your client’s decision, not a substitute for a valuer’s report where a lender or the law requires one.
Key takeaways
- Less competition: sales from June to October were 29% below a year ago, so there are fewer buyers at each open home.
- More choice: 2.2 new listings for every sale, up from 1.4, so briefs are easier to fill.
- More leverage: campaigns are 8 days longer on average, and only about four in ten capital city auctions are selling.
- Prices are adjusting: the national house median is about 8% below April’s peak, so older comps overstate value.
- Investors have stepped back: investor lending fell a record 32% in the September quarter, so your clients face fewer investor bidders.
- New advice for investors: the 2027 tax changes mean investor clients need a plan built around new builds, yield and holding periods.
- The causes haven’t turned: inflation, rates and confidence still point the same way, so the buyer’s market has further to run.
Frequently asked questions
Is it a buyer’s market in Australia right now?
On the national data, yes. From June to October 2026, sales were 29% lower than a year earlier, new listings were 6.5% higher, there were 2.2 new listings for every sale and homes took 8 days longer to sell. Conditions vary by state and suburb, so check the local numbers.
Which states favour buyers most?
Queensland and Western Australia. Both have sales down by about a third, listings up 11–18% and campaigns 11–14 days longer than a year ago. Tasmania and the ACT have seen the smallest shift.
Did the May 2026 budget cause the slowdown?
It added to a slowdown that had already started. Inflation turned up from mid-2025, the RBA raised rates three times before the budget, and investor lending and sentiment were already falling. The budget’s negative gearing and capital gains changes then hit investor demand directly: in the first full quarter after the budget, investor lending fell a record 32%.
Do the negative gearing changes affect owner-occupiers?
No. They apply to investors, and only from 1 July 2027. Properties held before 7:30pm on budget night keep the current rules. Investors should get advice from their accountant on how the changes apply to them.
Are property prices falling?
Yes, modestly. On a three-month average the national house median is about 8% below its April 2026 peak, and Cotality’s index is 6.7% below its March peak. NSW (−9% on a year ago), the ACT (−6%) and Queensland (−4%) have the biggest falls. Units are holding up better than houses.
What does listings per sale tell you?
It compares how many homes come to market with how many sell. A ratio around 1.5 has been balanced in recent conditions. When it rises, unsold stock builds up and buyers have more choice and more leverage. In October 2026 it was 2.8.
How should a buyer’s agent approach auctions now?
With most auctions passing in or being withdrawn, much of the opportunity is after auction day. Track the properties that passed in and approach the agent early the following week, with finance in place and an offer based on recent comparable sales.
Is a Stash price estimate a valuation?
No. The Stash AVM, Stash AI and Claude with Stash data give market estimates based on sales evidence. They help you plan an offer, but they are not a formal valuation by a certified valuer.
Get this picture for your client’s suburb
Suburb data, the agents who are active now, who’s discounting, and three ways to price it, all in Stash.