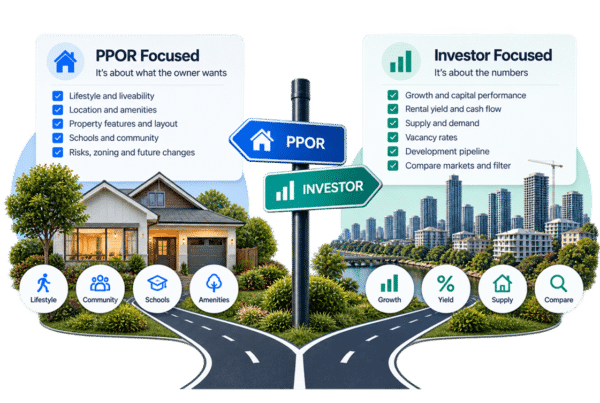



What should you look for in a suburb?
Updated November 2026: we fixed a page layout fault that repeated sections, matched the steps and filter names to the current Hotspots screen, corrected the vacancy rate definition and reran the Queensland example with November 2026 data.
We analyse every suburb in the country and rank them based on their investment criteria.
Australia is a vast country with over 15,000 suburbs, each with its unique culture, opportunities, and real estate market conditions. For property investors, choosing the right suburb can be a bewildering challenge, but it can also be the difference between moderate returns and a highly successful investment.
How many suburbs are there in Australia? The ABS counts 15,377 suburbs and localities covering the whole country in its Australian Statistical Geography Standard, Edition 4 (July 2026). The previous edition, used for the 2021 Census, had 15,353.
Hotspots is designed to help investors like you find investment-ready suburbs to buy properties in with ease. With Hotspots, you can easily discover the suburbs that have been growing, have the lowest vacancy rates, the highest yields and lowest days on market, so you can build a shortlist that fits your strategy before you look for deals.

Become a property investor in 7 days
Stash partners with some of the leading property investment & development educators in Australia.
Become a member of Stash to learn the ropes on becoming a property investor or developer. Take the 7 day challenge and get free access to Stash to begin your path to financial freedom.
Here are the questions Hotspots answers for you…
- Find suburbs with properties likely in your price range
- Does the suburb have liquidity?
- Has this suburb experienced high growth in the last year?
- Does this suburb have good rental yield?
- Will I be able to rent it? What’s the vacancy rate?
- Does the suburb have a lot of owner occupiers or a lot of rentals?
- How quickly do properties sell once they are on the market?
- Are there good schools?
- Does the suburb have a good mix of properties, ripe for renovation?
- How many people live in the suburb?
Check out this example…
What suburb in Queensland has:
- Suburb Growth over 5% in the last 12 months
- Over 50 sales each year
- A Rental Yield greater than 4%
- Low Vacancy of under 2%
- Good mix of house prices with a wide IQR range
- Schools in the top 50% socio-economically
- Over 5000 people in the suburb (Rule out small towns)
- Over half own their properties
- Over 10% of properties on the market selling every month
- And properties selling in less than 50 days
You can refine your search to find the suburbs that match your strategy
How to find investment-ready suburbs in Stash today
- Open Hotspots. In the side menu, choose Find Suburbs.
- Set the basics. Pick a State, and optionally one or more councils under Council. Choose a Property Type and a Median Price range.
- Start from a preset (optional). Choose one under Strategy Presets to fill in the sliders for a common strategy, then adjust them.
- Move the sliders. They are grouped into Market Performance (growth, sales volume, market absorption, days on market), Investment & Yield (rental yield, vacancy rate, IQR variance, affordability), Development, Demographics & Social (schools, social profile, population, owner occupiers) and Location (Metro, Coastal or Regional, distance from a major city, and Exclude Mining Towns).
- Sort and search. Choose a Sort order, such as Rental Yield - Descending, then click the SEARCH n RESULTS button. If it says NO RESULTS FOUND, widen one or two sliders.
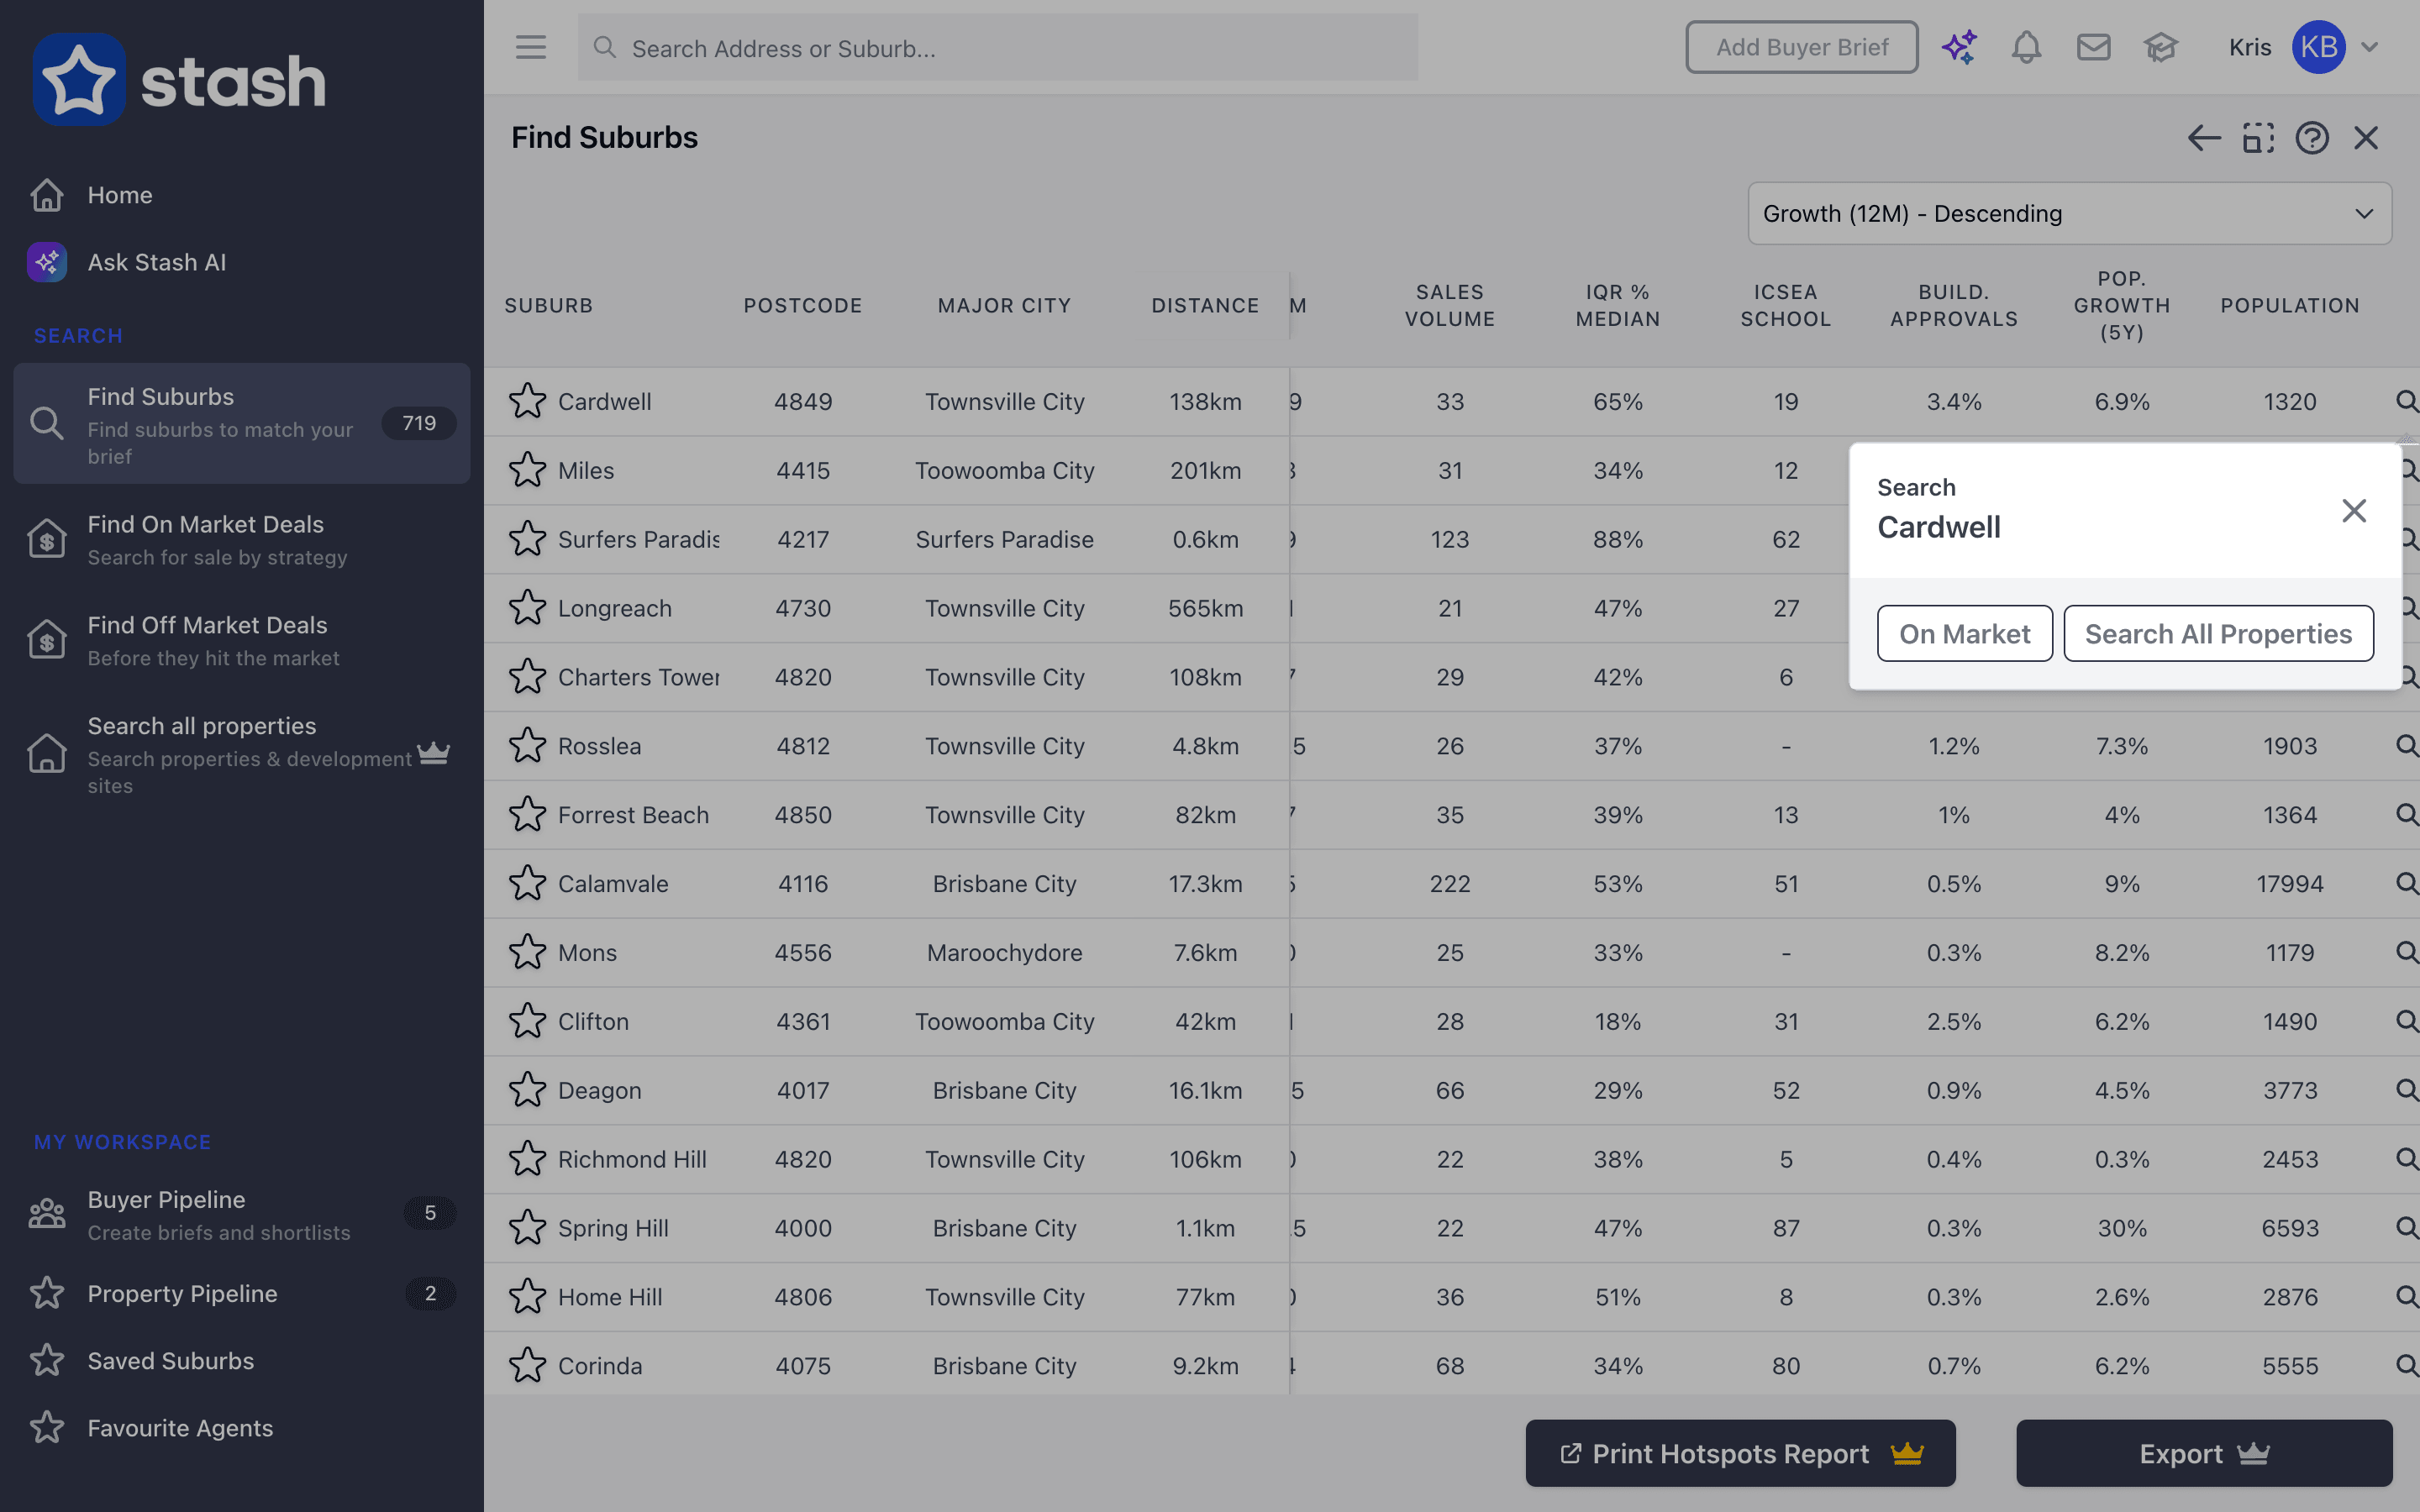
- Go from suburb to deals. Click the magnifying glass on a suburb’s row, then On Market to see what’s for sale or Search All Properties to search every property in the suburb.
- Save it. Click SAVE THIS SEARCH so you can rerun it next month as the data updates.
The full steps are in the Hotspots help article, and every measure is defined in the Stash data dictionary.
The same Queensland search in November 2026
We ran the example above again for houses in Queensland (all criteria except the IQR range), sorted by rental yield. The top three results were all on the Gold Coast (Stash data, November 2026):
- Merrimac: median house price $1,000,000, 10.5% growth over 12 months, 4.6% rental yield, 0.5% vacancy, 36 median days on market.
- Varsity Lakes: median $1,265,000, 18.8% growth, 4.3% yield, 0.5% vacancy, 29 days on market.
- Burleigh Heads: median $1,740,000, 12.3% growth, 4.3% yield, 1.2% vacancy, 47 days on market.
The figures update every month, so the list you get today may differ. Treat it as a shortlist to research, not a recommendation. This article is general information, not financial advice.
What are the best suburbs to invest in? Find out with Stash.
What to look for when choosing a suburb to invest in?
Suburb Growth
Suburb growth is the change in median home values in a specific suburb over a 12-month period, with a positive growth rate indicating an increase in home values and a negative rate indicating a decrease. Hotspots also shows Suburb Growth (10 YR CAGR), the average yearly growth over 10 years. Pro Tip: Previous growth is no guarantee of future growth, so you may want to search for suburbs that have had a downturn.
Vacancy Rate
Vacancy rate is the percentage of rental properties in a specific area that are unoccupied or available for rent, measured over one month. It indicates the demand for rental properties in an area. Pro Tip: You will want to make sure there is someone who is going to rent your property. A low vacancy rate is what you are after.
Market Absorption
Market absorption is the rate at which listed properties are selling in a specific area, indicating the demand for properties in the area and the overall health of the real estate market. Pro Tip: A high market absorption indicates the % of properties on market that sell each month. The higher the better.
Population
The population of a suburb is the total number of people who live in that suburb. It is a useful indicator of the size and density of a suburb, as well as the potential demand for services and infrastructure. Pro Tip: Refining by population helps remove smaller towns which may have inconsistent statistics
IQR Variance (% Median)
The IQR is based on the interquartile range of sales results and might be important for renovators. It measures how spread out the prices of the middle 50% of property sales are, as a percentage of the median. Pro Tip: Stash tags suburbs with an IQR between 30% and 60% of the median as Reno Potential. A higher IQR means the property sale values are more spread out and may have a higher potential for adding value through renovation or knock down rebuild.
Rental Yield
Rental yield is the annual rental income from a property as a percentage of its value, calculated over a 12-month period. It provides an indication of the potential return on investment for a rental property. Pro Tip: Whether the rent covers your repayments depends on your interest rate, deposit and holding costs, but a higher yield gives you a better chance of being positively geared.
Owner Occupier
Owner occupier as a percentage of a suburb refers to the proportion of homes in the area that are owned and occupied by their owners, as opposed to being rented out. This statistic provides an insight into the nature of the housing market in a specific suburb. Pro Tip: Do you want to buy in a suburb with renters as neighbours or established home owners?
Sales Volume
The sale volume over 12 months in a suburb is the total number of properties that have sold in the suburb over the past 12 months. Pro Tip: It is a useful indicator of the level of activity in the property market in the suburb. A higher volume of sales should provide more confidence in the statistics being displayed and won’t be impacted by outlier sales.
Days on Market
Days on market (DOM) for a suburb is the average time properties in the area stay on the market before being sold or taken off the market, calculated over the last 12 months. It reflects the demand and competition for properties in the area. Pro Tip: If you are looking to flip, how quickly are you going to be able to sell it? DOM is a good guide to how long you might be waiting.
School ICSEA (Suburb Avg)
The ICSEA (suburb average) is the average ICSEA (Index of Community Socio-Educational Advantage) score for all Government schools in the suburb. Pro Tip: It is a useful indicator of the socio-educational advantage of students in the suburb as a whole. It’s a great tool to narrow down suburbs in areas you are not familiar with.
Once you have suburbs that match your investment strategy, use Find On Market Deals to find renovator or development opportunities or that bargain property to purchase, or Search all properties to find development-zoned properties or splitter blocks before they hit the market.
Don’t forget to check out our fully integrated flood maps, bushfire maps, heritage register and biodiversity maps to help you identify potential risks and obstacles, and plan accordingly. See map layers and overlays.
Find your needle in the haystack today. Sign up for our free trial and start finding great deals fast!
Happy Stashing!