
What vacancy rate do you trust?
If you’ve ever compared vacancy rates across different property websites, you’ve probably noticed they rarely agree.
One provider might show a suburb at 0.8%.
Another might show 1.4%.
Another might show 2.1%.
So which one is correct?
The answer is: they may all be correct.
Vacancy rates are estimates, not fixed measurements.
Every provider uses its own data sources, methodology and assumptions.
What Is a Vacancy Rate?
At its simplest, a vacancy rate measures the proportion of rental properties that are currently empty and available to lease.
Vacancy Rate = Vacant Rental Listings ÷ Total Rental Dwellings
The formula looks simple. The hard part is estimating how many rental dwellings actually exist in a suburb today.
Most providers can identify advertised rental listings reasonably well. The real challenge is the denominator: the estimated size of the rental market.
The biggest difference usually isn’t how many rental listings are counted. It is how each provider estimates the total number of rental dwellings in the market today.
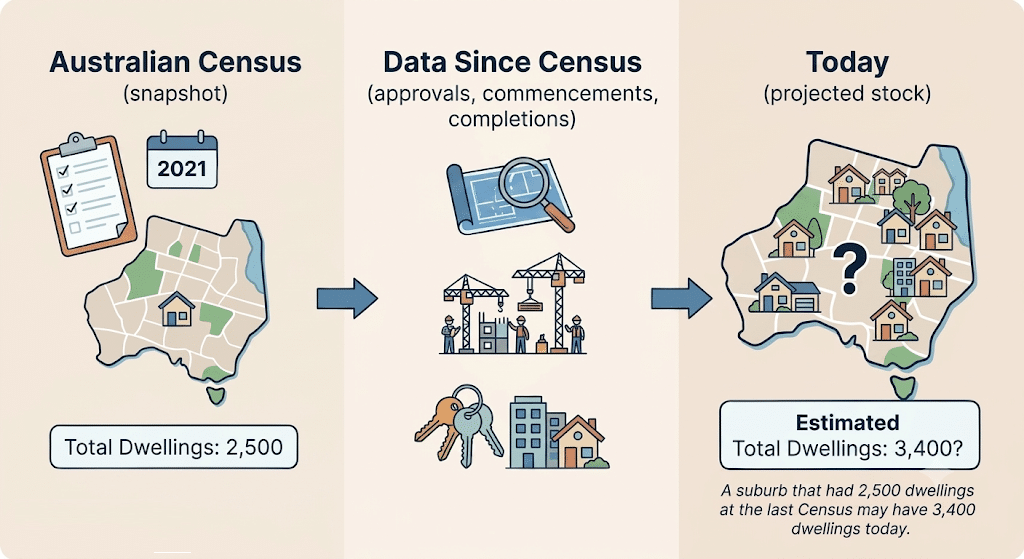
The Census Only Gives Us a Snapshot
The Australian Census provides one of the best snapshots of Australia’s housing stock. It tells us how many dwellings existed at a point in time, how many were occupied, how many were rented and how many were owner occupied.
The issue is timing.
The Census only happens every five years. Between Census periods, suburbs can change dramatically. New estates are built. Apartment towers are completed. Older homes are demolished. Properties move between owner occupation, long-term rental, short-term rental and vacancy.
The last Census was in 2021
Since then, every provider has had to estimate how many homes have been built, demolished or converted. Those different estimation methods are one of the biggest reasons vacancy rates can vary between data providers.
How Providers Estimate Today’s Housing Supply
Because there is no live official register of every rental dwelling in Australia, data providers need to estimate current dwelling stock. They may use a combination of:
Building Approvals
Councils approve new dwellings before they are built. These approvals indicate future supply, but not every approval becomes a completed home.
Commencements
Construction starts after approval, but timing varies. Some projects begin quickly while others are delayed.
Completions
Completed dwellings are much closer to real supply, but still may not become rental stock immediately.
Rental Stock
Only some completed dwellings enter the long-term rental market. Others are owner occupied, vacant or used for short-term accommodation.
Approvals are a leading indicator, not a final supply count
Building approvals are useful because they tell you what may be coming. But they should not be treated the same as completed dwellings. The gap between approval and completion can be significant, especially in apartment markets and growth corridors.
Fast-Growing Suburbs Are Hardest to Measure
The biggest differences usually appear in suburbs with rapid housing growth.
This includes areas with:
- Large land releases
- Master planned communities
- Apartment precincts
- Urban renewal projects
- High levels of infill development
In these markets, the total number of dwellings can change quickly between Census periods. If two providers model that growth differently, their vacancy rates can be materially different even if they are looking at similar rental listing data.
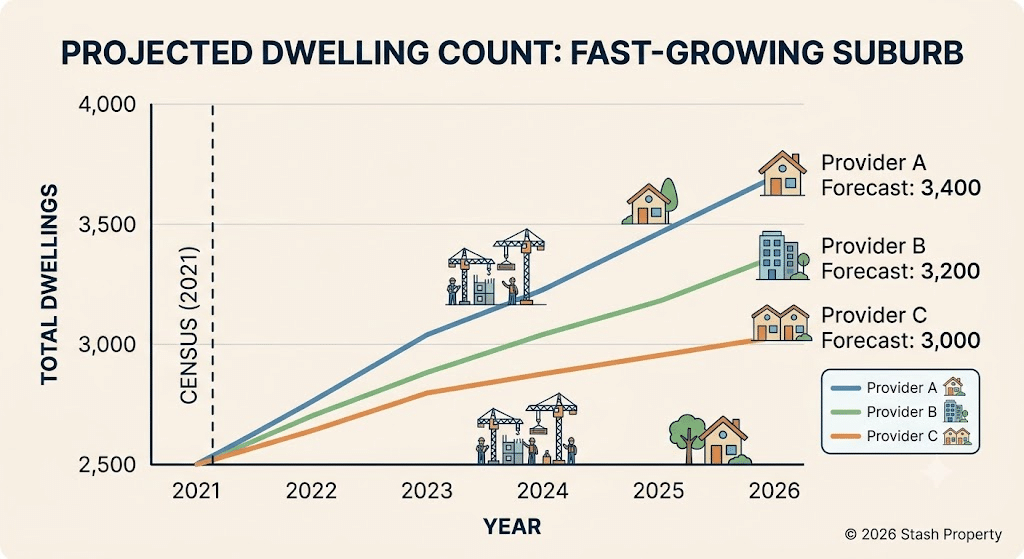
Example Suburb
Assume a fast-growing suburb has 40 advertised rental properties. Provider A estimates there are 3,400 dwellings. Provider B estimates there are 3,200 rental dwellings & Provider C estimates there are 3,000 rental dwellings.
- 50 ÷ 3,400 = 1.4%
- 50 ÷ 3,200 = 1.5%
- 50 ÷ 3,000 = 1.6%
The number of advertised rentals is identical. The vacancy rate changes because the estimated rental stock is different.
Consistency Matters More Than the Number
Many investors compare vacancy rates across multiple websites and end up more confused. A better approach is to use one consistent methodology when comparing suburbs. Whether a provider reports 1.1% or 1.4% matters less than whether the same methodology is applied consistently across every suburb you are comparing. Consistency makes comparison useful. Mixing providers can introduce multiple methodologies into the same analysis.
The Bottom Line
Vacancy rates differ because providers are estimating something that no one measures directly in real time. Most providers can identify vacant rental listings reasonably well.
The real challenge is estimating how many rental dwellings actually exist today. That requires modelling current housing stock using Census data, building approvals, completions, development activity and statistical assumptions.
Different assumptions naturally produce different vacancy rates. The best investment decisions are not based on a single percentage. They are built by understanding the story behind the data.
Frequently Asked Questions
Why do vacancy rates differ between property websites?
Because each provider estimates Australia’s current rental housing stock differently. Most providers use rental listing data, but the estimated number of total rental dwellings can vary significantly.
Are vacancy rates accurate?
They are useful estimates based on available data. They should be interpreted alongside other market indicators rather than treated as an exact measurement.
Is a lower vacancy rate always better?
Not always. A very low vacancy rate may suggest tight rental supply today, but future housing supply, affordability and local demand also matter.
Should I compare vacancy rates across providers?
It is generally better to use one provider consistently when comparing suburbs, rather than mixing different methodologies.
What other metrics should I consider?
Rental growth, days on market, building approvals, future supply, population growth, employment trends and owner occupier demand all help build a more complete picture.
Understand the Data Behind the Market
Vacancy rates are only one part of the story. To properly assess a suburb, you need to understand rental demand, housing supply, future development and local market momentum together.